Kindly refer the below screenshot, when I select the names in pie chart, it displays only one name and values for one option only, how can I fix it to see all the names and values.
Hi @ayushlawania,
Welcom to the eazyBI community! I appreciate your keen observation regarding the chart in the image you shared.
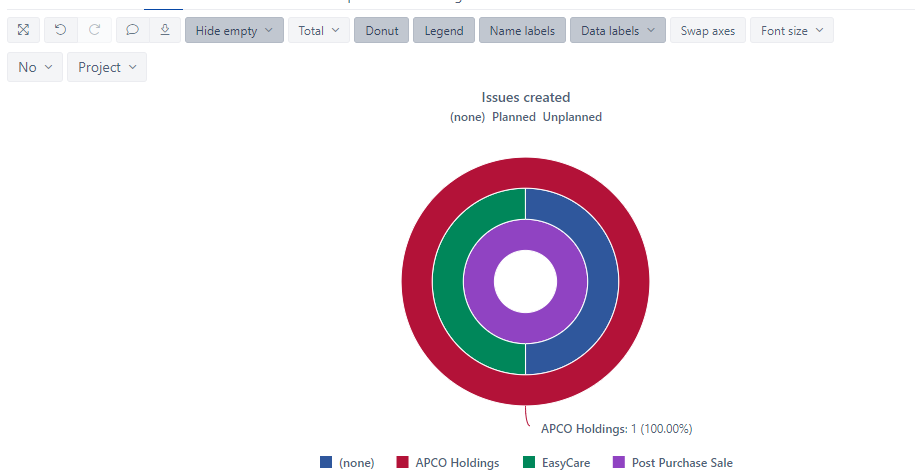
The chart you’re referring to is a Nested Donut chart, designed for visualizing multiple series within a single visualization. This proves particularly useful when aiming to showcase the distribution of different categories or slices of data. In your specific scenario, the layers are represented by APCO Holdings, EasyCare, etc.
Given the hierarchical nature of the Nested Donut chart, it is intended to display labels only for the first layer. In your case, with APCO Holdings occupying 100%, there’s only one label visible.
To access detailed information, including labels and values, you can easily hover over the specific area of interest on the donut chart.
I understand this might be inconvenient, and I appreciate your understanding. If you have any further questions or if there’s anything else I can assist you with, feel free to let me know.
Kind regards,
Ilze