Hi.
I am pretty new to eazyBI and especially to MDX. The problem is not very complex, but I still can’t figure it out.
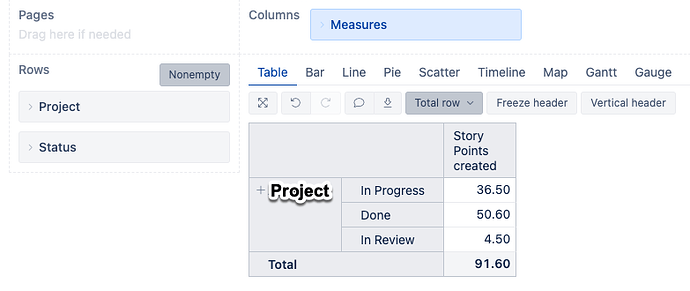
Here is the Situation: We have a capacity of 100 story points in a project. I want to create a pie chart with the categories DONE, IN REVIEW, IN PROGRESS and OPEN.
OPEN should be calculated by 100 - Total. So instead of the Total row, I need an Open row (in this case with the value 8.4).
I know how to create calculated memebers, I just can’t figure out the MDX expression.
Thanks for your help 
Hi @Matthias_Frohlich,
Welcome to the eazyBI community!
The pie chart is built from the same level data series.
There are several options for getting “Remaining story points” in the same pie with several different statuses.
First, you might create a calculated measure “Remaining story points” where you subtract the story points relevant to any of statuses from 100.
The expression might be as follows.
100
 -
[Measures].[Story points created]
Then you might add this measure to the report. You will see that it creates additional columns for each of the displayed statuses.
Then you might remove the Status dimension from report rows. Then you have two columns - created and remaining story points.
The next step is to drill into the “Story points created” measure by the Status level of Status dimension.
Please read more about that here - Drill into measure
Now you have four columns - three with created story points split by statuses and one with remaining story points.
When you apply the pie chart formatting, you will see a multitude of circles. Select “swap axes” to “rotate” the dataset and get the correct pies.
Another option is to create a “dummy” calculated status and create a calculated measure that behaves differently depending on the current Status.
Regards,
Oskars / support@eazyBI.com
![]()
