I’m trying to create a graph that shows a daily rundown of issues NOT closed yet during the sprint (after it’s completed).
It’s almost, but not quite like “open issues”, because the latter doesn’t catch irregularities that I’m after (e.g. issues closed before or after the sprint proper).
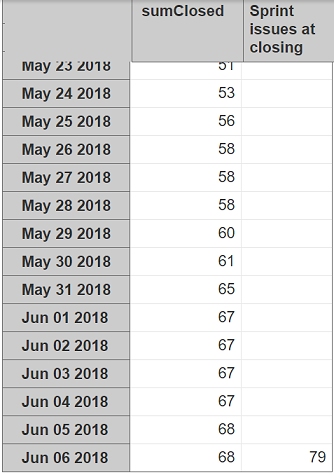
I can get the correct total count through [Measures].[Sprint issues at closing], but I can’t figure out how to use it for a running count, since the number appears only during the day when the sprint was closed (in my example, 6 June). For the rest of the days, it’s null.
For a running cumulative count of closed issues, I have:
Could it be that it’s a limitation (or feature, if you will) of EazyBI and nothing can be done? I’ve also rummaged through all community topics and official examples involving anything with “cumulative” in it, and so far, nothing.
There is a hidden measure [Measures].[Transitions to] that shows wow many times during selected Time dimension period issue has changes to some value in any default field (Status, Assignee, Sprint, Issue type, Priority, Resolution) or any custom field with enabled value changes.
You can use that to find in what sprints issues have been and after that you can filter the issues that are open or any other result that you would like to have.