My dear friends, I would greatly appreciate the help of all of you.
I have been implementing reports for some time now and I have been enjoying EazyBI a lot and it has been requested to me as part of the POC that I am organizing.
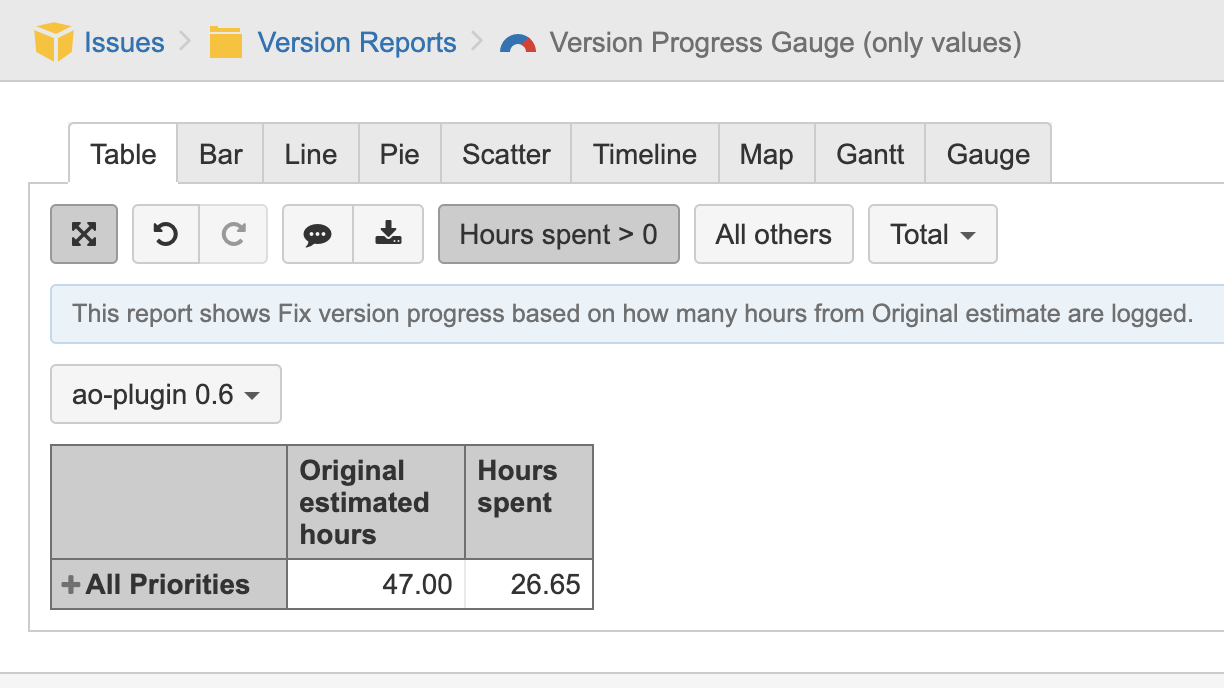
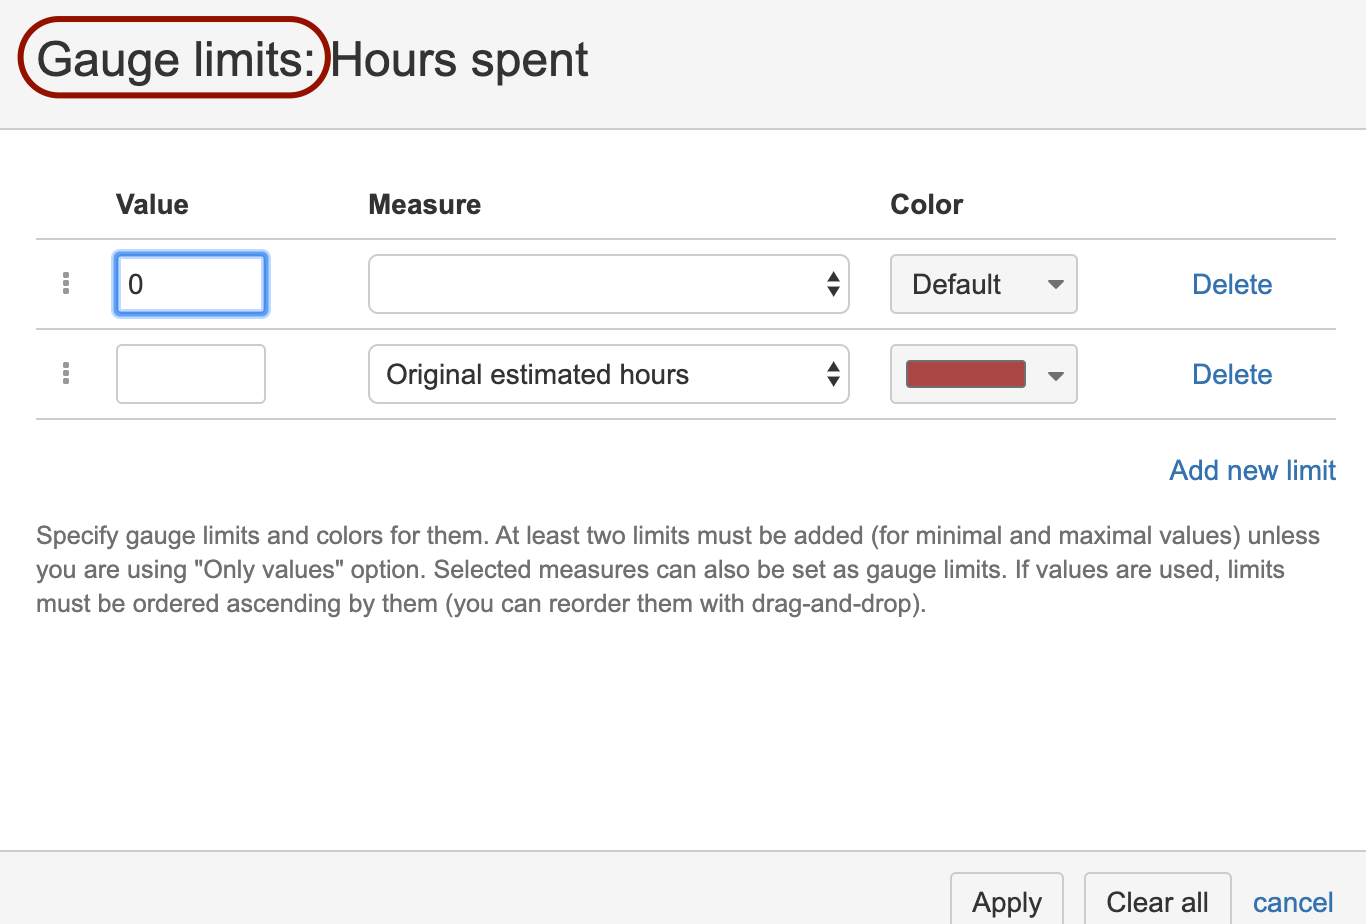
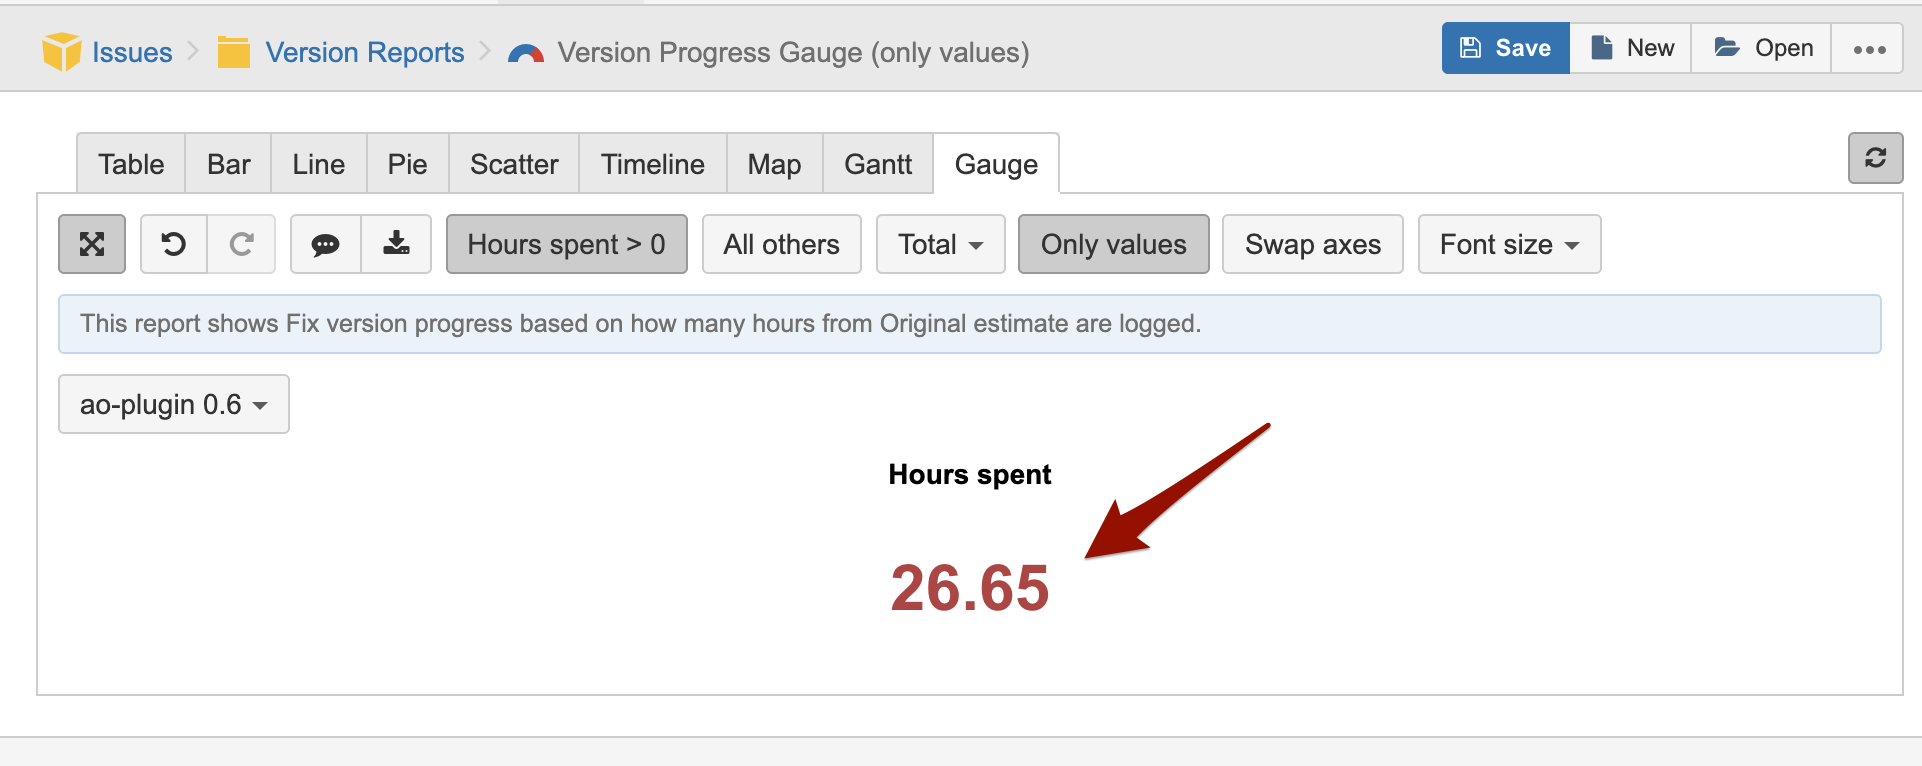
I needed to create a Gauge chart where it was possible to identify the velocity trend if it is going up or down. May be an ARROW based on the last 5 sprints
Something simple and that can be complementary. Just an arrow.