Hey there,
Very new to EazyBI and trying to come up with some use cases to get this over the line.
I am importing ‘Assets’ (previously Insight) data into EazyBI which is very very easy and handy to be able to access.
I have already produced a couple of bar charts and such which is amazing, but I am struggling with counts.
In our hardware Object type we have hardware make, model, purchasing info etc and importantly we have Warranty Expiry Date.
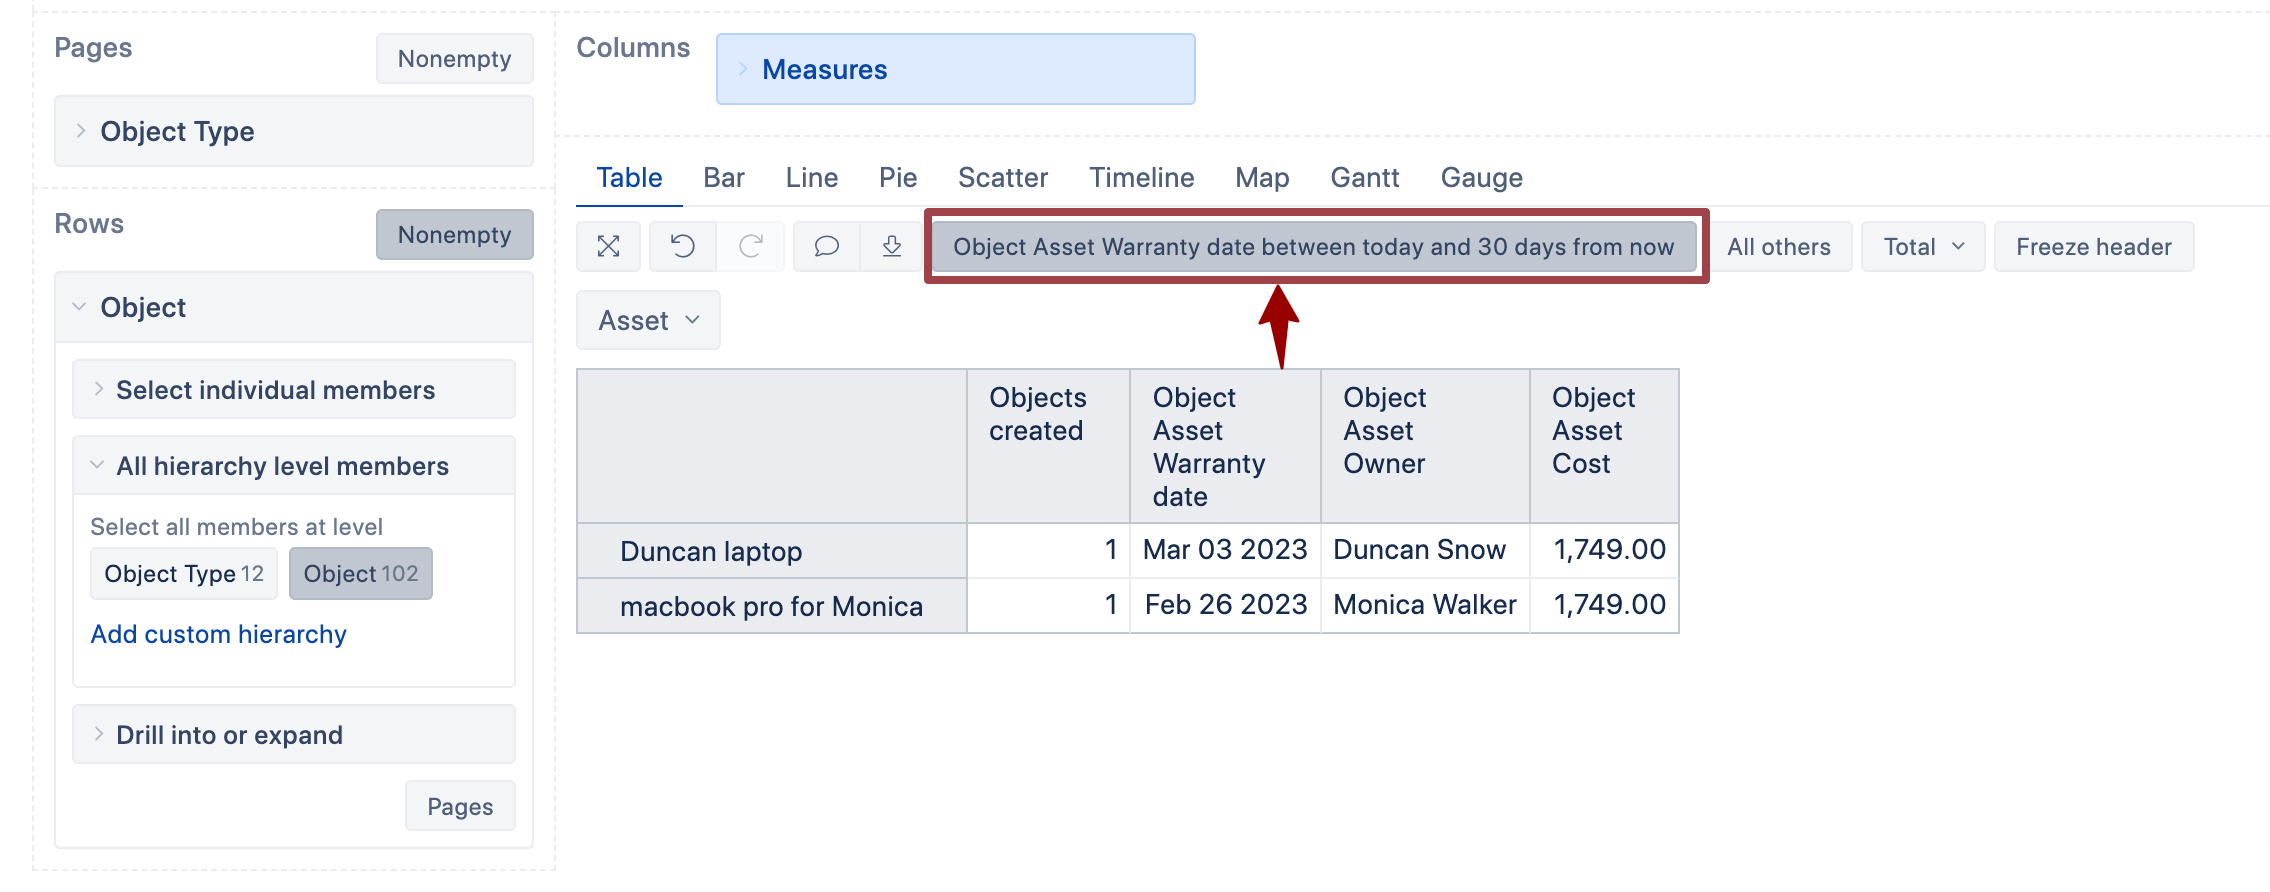
I would like to create something that will show a list of assets that are going to expire in the next 30 days, so when this is on a dashboard it will always show a rolling 30 days from the current date dataset. Ideally then to be able to drill down into the asset to get more information.
I have the Warranty field as a measure, I have the objects and time in the rows but I just can’t get it all to hang together to give me a date and a number and then the option to drill down into that number to see what assets are there.
Is this achievable?
Many thanks.