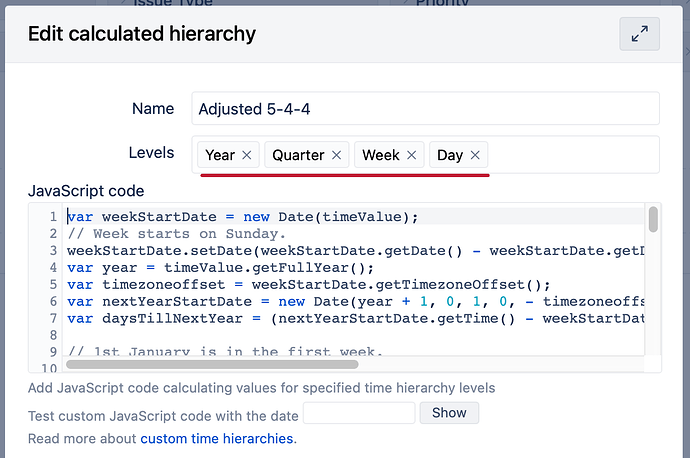
Hello! EazyBI Community.
I have created a report using the 5-4-4 structure, but I’m facing an issue with how the time periods are displayed.
When transitioning to the next month, the weeks do not automatically expand; instead, they aggregate into monthly increments. This means I have to manually expand each month to view the weekly data, which is quite cumbersome.
Specifically, instead of seeing the data grouped by month like this:
| Column 1 | Column 2 | |
|---|---|---|
| 1 Month | value | value |
| 2 Month | value | value |
I need it to automatically display in weekly intervals, as follows:
| Column 1 | Column 2 | |
|---|---|---|
| 1W | value | value |
| 2W | value | value |
| 3W | value | value |
| 4W | value | value |
| 5W | value | value |
| 6W | value | value |
| 7W | value | value |
| 8W | value | value |
and so on for subsequent months.
Is there a setting or method within EazyBI to ensure that the weeks automatically expand and display in this weekly format without manual intervention?
OR
How can I configure it to display only in Week units without Months?
Thank you for your assistance!
Best regards
