Hi everyone, good day!
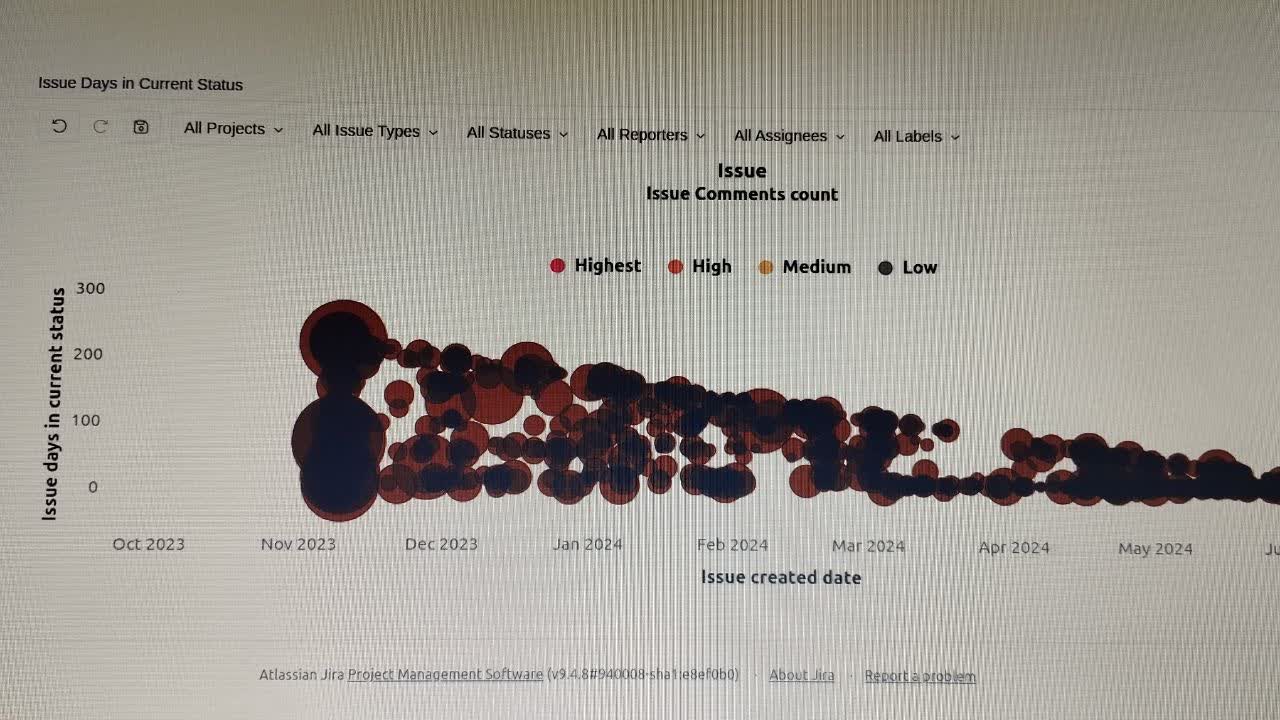
i created a scatter chart for “days in current status” with the measure sample in Eazybi demo like this:
– days in current status from last status update
CASE WHEN not IsEmpty([Measures].[Issue status updated date])
THEN
DateDiffDays([Measures].[Issue status updated date], Now())
END
However, I put the “priority” in the column and bubbled with “last comment count”, but all of the bubbles have the same color!
In your opinion, why is this happening?
Hi,
My first guess is that bubbles won’t change colors because there are no numeric measures used in the report. Measures like “Issue days in current status”, “Issue comment count” are not actual numeric meaures in eazyBI reports even if they return numeric results on issue level.
Please check this demo report: Cycle time scatter plot per priorities - Issues - Jira Demo - eazyBI
If I switch to table view and replace the “Cycle days in Progress” (which is a numeric measure in eazyBI) with the property “Issue Progresss days” (which is a property measure) the report will not show different colors for priorities anymore.
Martins / eazyBI
Thanks a lot. Honestly, I changed the position of “Priority” from Column to Row, and the colors were fixed. However, for a few issues where the priority was changed (e.g., from low to high), the colors are still not fixed.
Hi @Mahmoud_Kavin
it is likely that these few issues appear under both (old and current) priorities in your report.
Please try these steps:
-
switch back to “table” view
-
add (temporarily) the measure “issues created” in report columns
-
remove (temporarily) the “Priority” dimension
-
filter report by the measure “issues created” as explained here (Issues created > 0):
Create reports
-
unselect measure “Issues created” from the report columns
-
add back Priority dimension and switch to scatter chart.
That should show only according to their current priority.
Martins / eazyBI