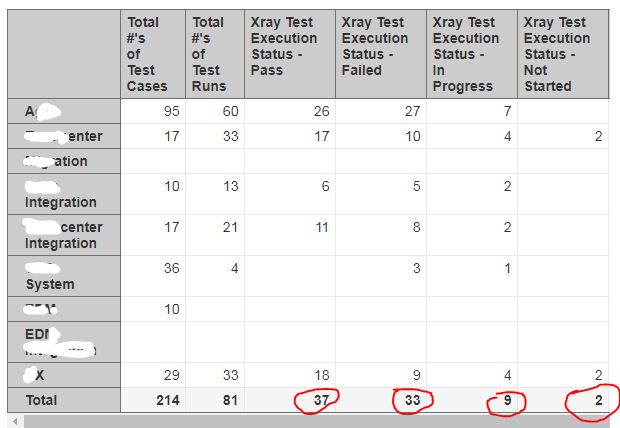
I found the total number in the bottom of the table is not correct. Well the total function is eazyBI’s built-in function. I cannot change it, but my custom calculated members. E.g. the MDX of calculated member ‘Xray Test Execution in Pass’ as the following:
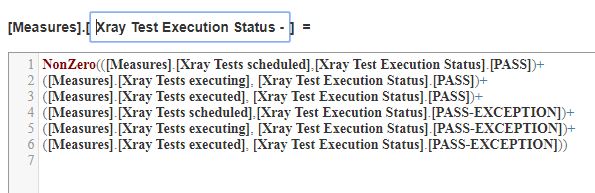
Can you pls tell me what place need to be optimized in my MDX ?Thanks
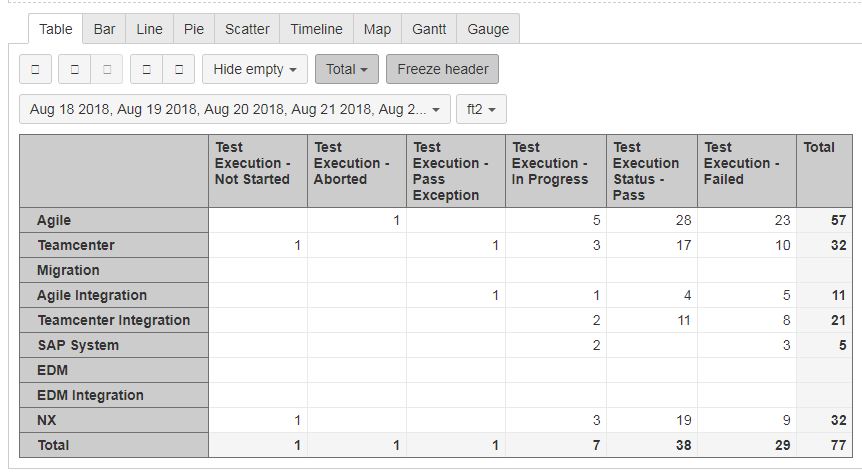
BTW, the rows are the Components underneath ‘Project’ dimension.
Hi,
Please reach out to support@eazybi.com about this question!
Thanks!
Martins / eazyBI support
Hi,
A component is a multi-selection field; one issue may have two or more components. If a test execution has two components (from your screenshot “***enter” and “***X”), then it is counted for each row, but in the total row is counted only once.
Regarding calculated measure. If you would like to see test count by the execution status then I would recommend using measure Xray tests with executions and dimension Xray Test Execution Status.
Best,
Zane / support@eazyBI.com
1 Like
Thanks Zene.
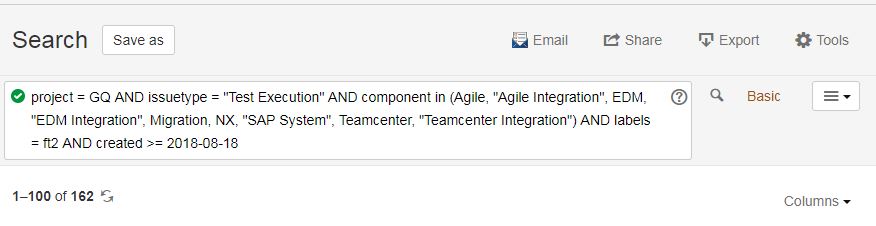
Although ‘Xray tests with executions’ can avoid the summary deviation, its output is less than my JIRA filter result in the same conditions. JIRA has 162 items
But Measure ‘Xray Tests with executions’ shows the inconsistent stats.
.
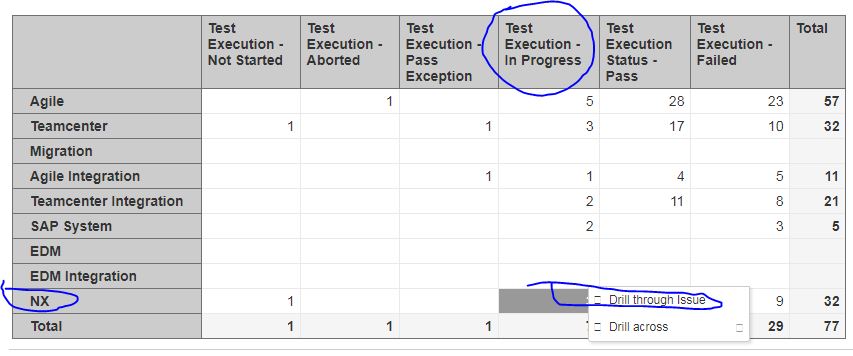
I took look at the figures in eazyBI analysis table, e.g. the cell by ‘NX’ and ‘Test Execution - In Progress’ , click on the figure and choose the option ‘Drill Thru Issue’
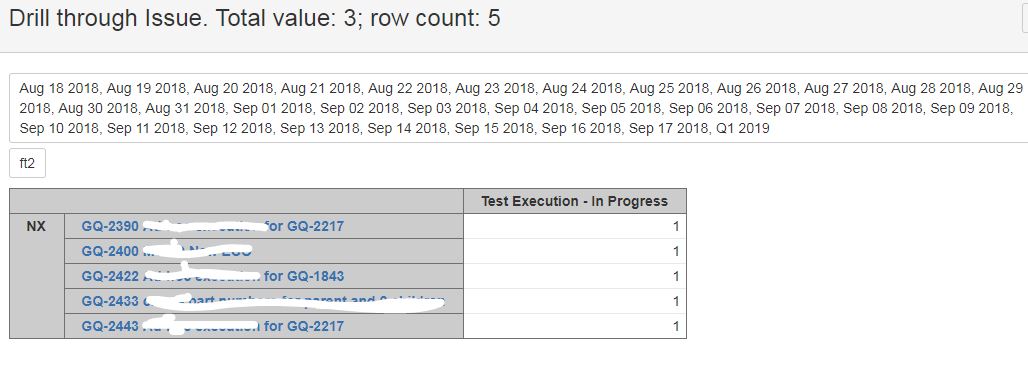
I can see the deviation between the analysis value (3) and the associated ‘Test Execution’ items (5).
I am not very clear of the inside MDX query of [Measures].[Xray Tests with executions] and [Xray Test Execution Status]. So, I do not know why they make the stats deviation not only for the individual cells, but also for total values.
Can you pls give me a workaround?
Thanks so much,
Frank