Hello,
I’ve been stumped on this for a while and I’m not sure what I’m doing wrong here.
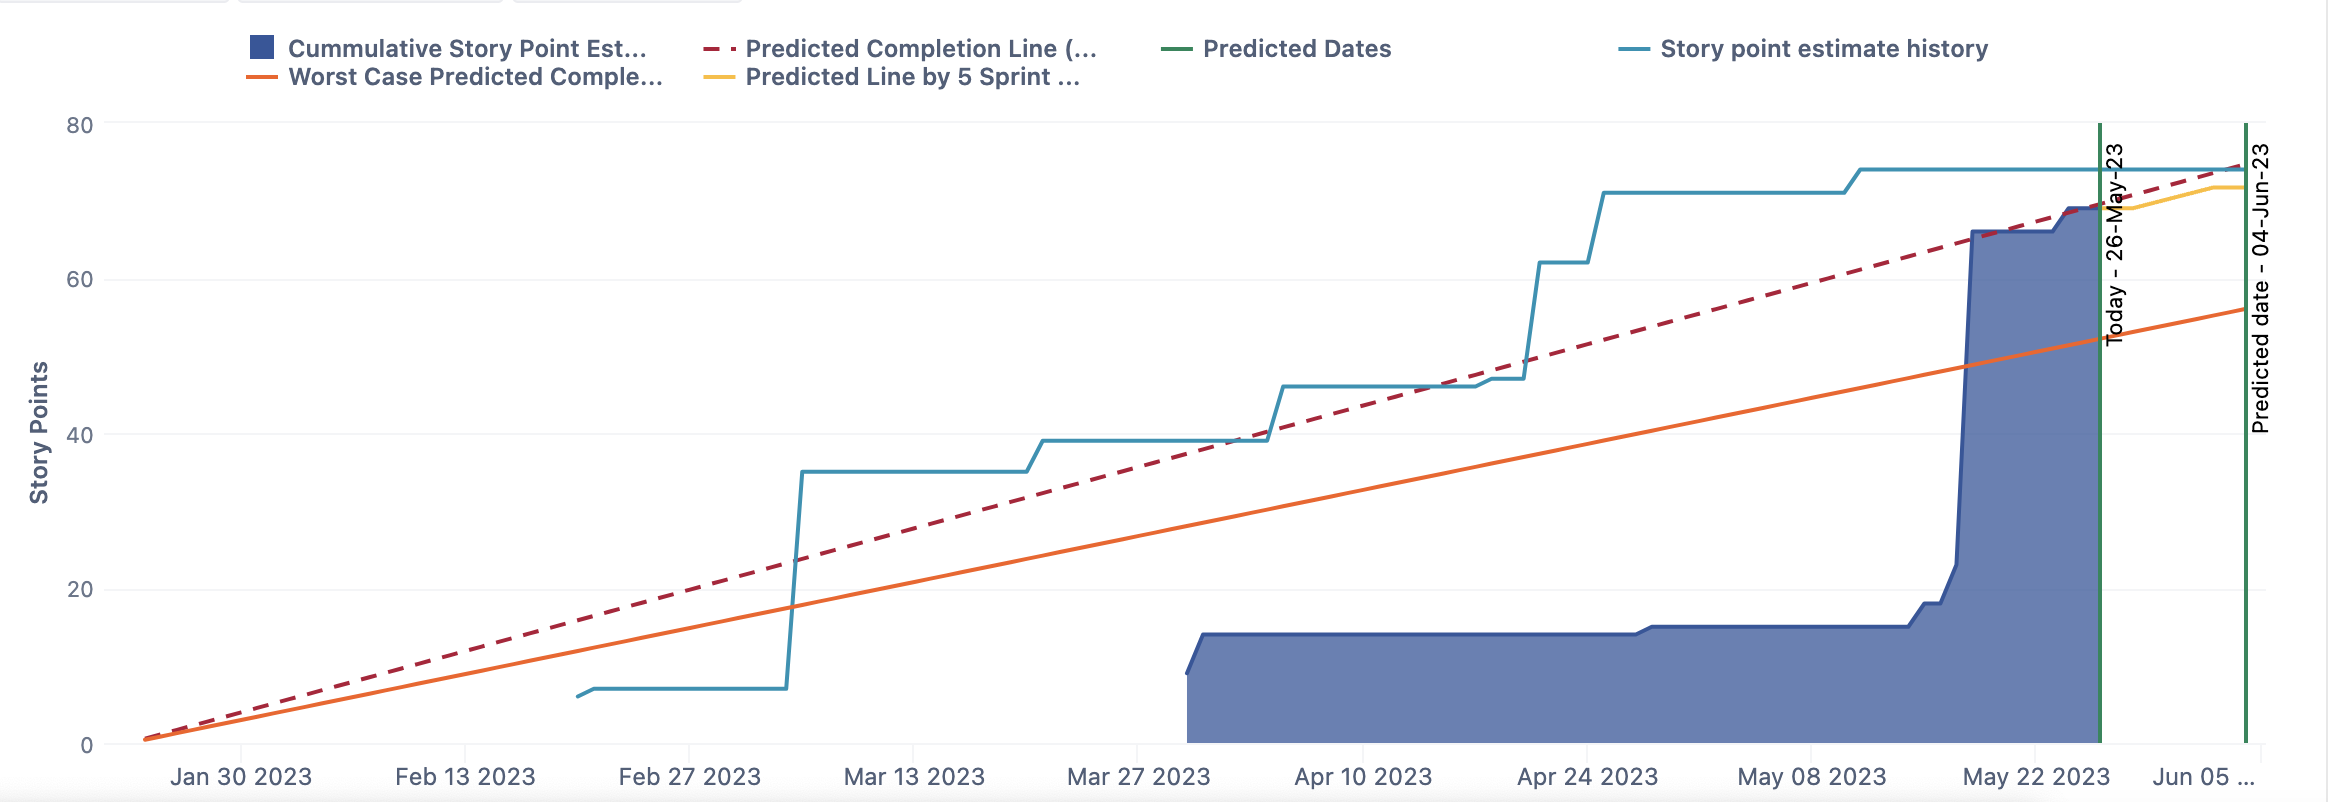
I am trying to build a projection chart, based on story points, that shows a predicted date. Now I’ve had no issue with the initial build, but I also want to have a worst case scenario projection. But at the moment I get the line showing up but it doesn’t continue beyond the actual prediction line.
I’ve been basing this chart on the Version Report Demo
This is currently how the chart looks:
This is calculated formula I’m using to get the worst case date:
Worst Case Predicted Completed Date Team
--annotations.group=Predicted
Cache(
Case when
  ([Measures].[Story Point estimate resolved],
   [Time].CurrentHierarchy.DefaultMember) > 0
   AND
   ([Measures].[Story point estimate due],
    [Time].CurrentHierarchy.DefaultMember) > 0
Then
  DateAddDays( "Today",
  -- add days to reach this ammount
  Cache(
  -- all currently open stroy points
    ([Measures].[Story point estimate due],
     [Time].CurrentHierarchy.DefaultMember)
      /
 -- divided by days performance
    Cache(
      -- currently resolved story points
       (([Measures].[Story point estimate resolved],
     [Time].CurrentHierarchy.DefaultMember)
      /
      -- days till today
      DateDiffDays(
       [Measures].[Project Start Date],
       "Today"))*0.75
    )
  )
)
End)
And this is the formula to draw the line:
Worst Case Predicted Completion Line (Team)
--annotations.group=Predicted
CASE WHEN
-- apply for predicted period only
 (DateinPeriod(
 [Measures].[Project Start Date],
 [Time].CurrentHierarchyMember)
 OR
 DateBetween([Time].CurrentHierarchyMember.StartDate,
 [Measures].[Project Start Date],
 [Measures].[Worst Case Predicted completed date Team]))
THEN
 -- pace of currently resolved points per day : total resolved days in version divided by days in version till today
  Cache(
  (([Measures].[Story point estimate resolved],
   [Time].CurrentHierarchy.DefaultMember)
   /
   DateDiffDays(
     [Measures].[Project Start Date],
     DateParse('Today')))*0.75
  )
  *
  -- calculate progress for each period from start date till period end or till predicted date
  Case
   when
     DateInPeriod([Measures].[Worst Case Predicted completed date Team],[Time].CurrentHierarchyMember)
   then
     DateDiffDays([Measures].[Project Start Date],[Measures].[Worst Case Predicted Completed Date Team]) + 1
   else
     DateDiffDays([Measures].[Project Start Date],[Time].CurrentHierarchyMember.NextStartDate)
  End
END
Thanks