Hi EazyBI team,
I created a report that counts the number of issues (on JIRA) of a specific type using custom measures, and filtering for projects and creation time using standard dimensions.
With the time filter “All Times”, I see correct results, and if I go on the Pie chart for drilling through the epics, the correct ones (and total number) are returned.
–
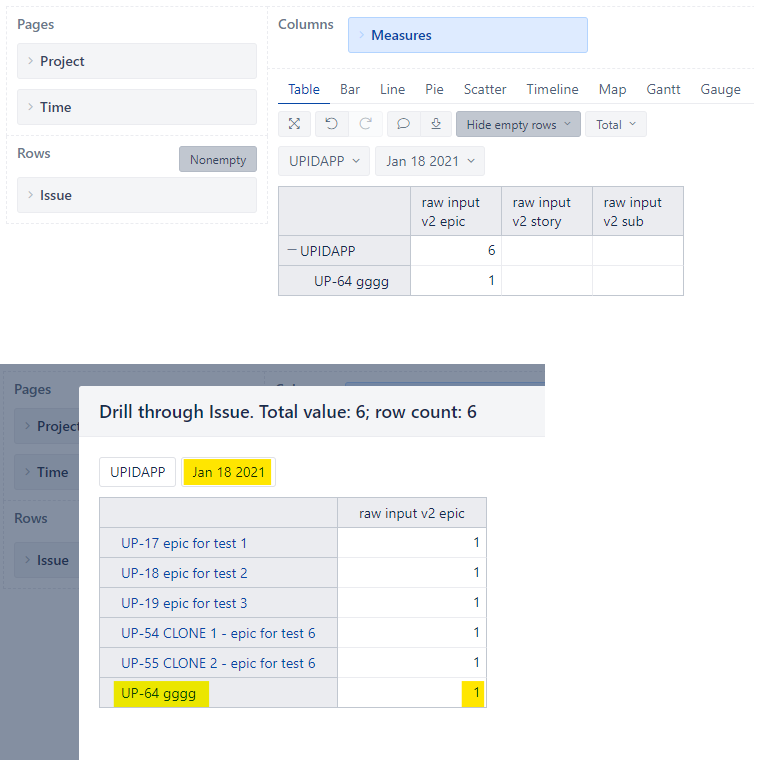
Now, I want to filter the epics created today (Jan 18) using the same measures: in the Table chart the right row Epic is returned, but I see that the sum on the project returns ALL the epics anyway.
And if I go the Pie chart for drilling through the epics, all the epics are returned indifferently from the Time filter, instead of just the only 1 highlighted:
–
This is the measure in question:
CASE
WHEN [Issue].CurrentHierarchyMember.Level.Name = ‘Project’ THEN
SUM(
Descendants([Issue].CurrentHierarchyMember, [Issue].[Issue]),
CASE WHEN [Measures].[Issue Tipologia Waste] = ‘Raw Waste’ AND [Measures].[Issue type] = ‘Epic’ THEN
[Measures].[Issues created]
END
)
WHEN [Issue].CurrentHierarchyMember.Level.Name = ‘Issue’ THEN
CASE WHEN [Measures].[Issue Tipologia Waste] = ‘Raw Waste’ AND [Measures].[Issue type] = ‘Epic’ THEN
1
END
END
(I did the same measure for the types ‘Story’ and ‘Sub-task’ too).
I really need a hand with this problem, if anyone could help me I would be grateful !
Thank you,
-FF-
P.S. forcing new users to use only ONE embedded media item in a post is devastating X _ X