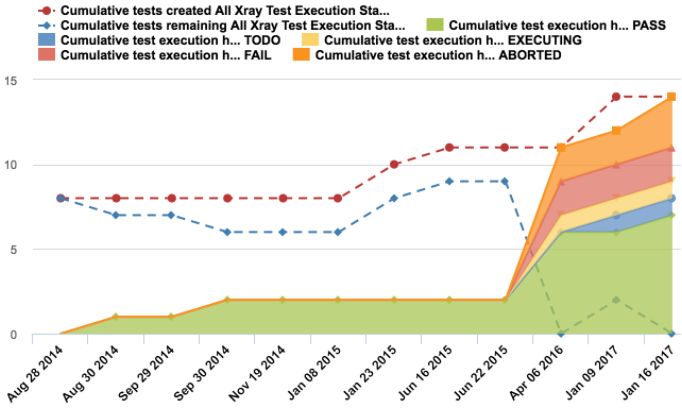
On the Xray Documentation Page, a Test evolution chart is shown as an exemple: Integration with eazyBI
I am trying to reproduce this graph using easyBI but I am stucked. I cannot figure what ‘Measures’ to use in order to plot test execution statuses over time.
A Cumulative Xray Tests executed by status graph is explained in details. Formula used in this publication:
Cache(
  Sum(
    Descendants([Xray Test].CurrentMember, [Xray Test].[Test]),
    CASE WHEN
      [Measures].[Cumulative Xray Tests executed] > 0
    THEN
      CASE WHEN
       [Xray Test Execution Status].CurrentMember.Level.Name = “Status”
      THEN
        CASE WHEN
		  Tail(Order([Xray Test Execution Status].Members,
		  [Measures].[Xray Test last status date])).Item(0) IS
		  [Xray Test Execution Status].CurrentMember
        THEN
          1
        END
      ELSE
        1
    END
  END
  )
)
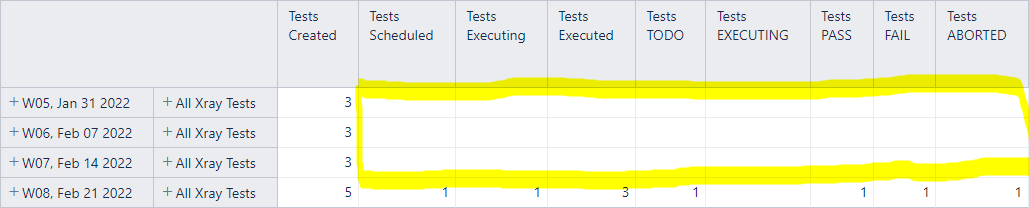
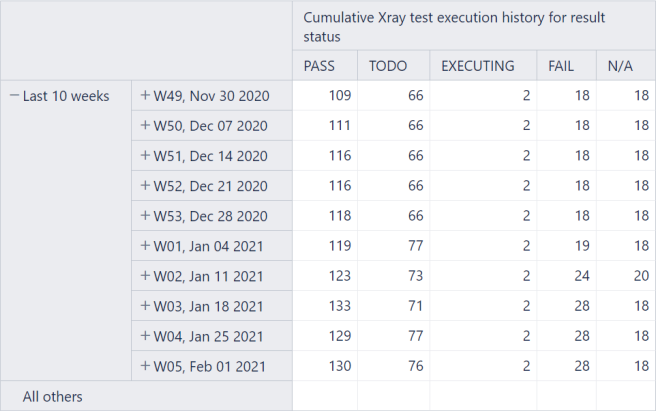
Resulting table:
However when I try to reproduce the settings, I am not getting any results.
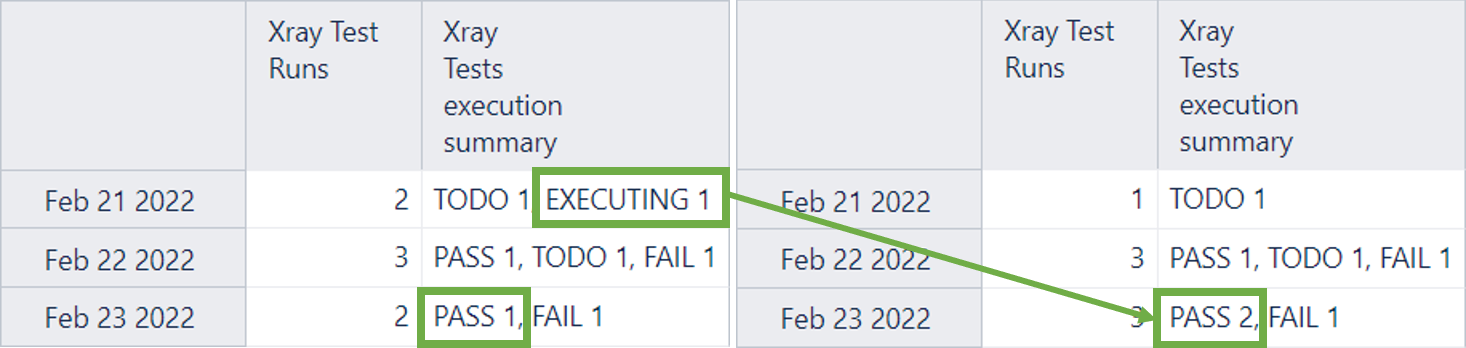
Left picture leads to the right picture when I run a test execution (EXECUTING → PASS).
So I am losing the test execution history and have only access to the current test execution status.
Is there a way to plot, day by day, the count of each test execution by statuses ? And if no test execution occurred for one specific day / test, then refer to the last test execution status ?
The “Test Burn-Down / Test Evolution chart” (report from the initial question) was withdrawn from eazyBI documentation (Xray Test Management) and eazyBI sample reports.
The solution had very resourceful calculations, and the report timed out for most cases.
Also, it didn’t work as expected for some use cases considering TODO and IN PROGRESS statuses because unfinished test runs do not have a Finished date and cannot be compared with the rest of the test executions.
If you would like to get some kind of burn-down in the test plan context, check out the documentation on building “Xray Test burnup for Test Plan”: Xray Test burnup for Test Plan
Available test run data in eazyBI are insufficient to create a day-by-day report of test runs and their execution result history. Therefore, only the latest (current) test runs status is available in eazyBI, and status is represented on the timeline by a finished date (or a started date if a finished date is not present).
Here are a few more topics on the late execution status within the given report context, like Test Plan, without the timeline.
Thanks for your reply. I understand why it’s not available anymore. I will keep on using the Jira Widget.
Regarding Xray Test burnup for Test Plan (eazybi.com), I already set this graph up on my environnement.