Hi,
I"m still trying to get up to speed with EazyBI in combination with XRay. Based on the information I’ve found on this community I could create a good Test plan status report already, but I have some other KPIs which are a bit more tricky to get out of the tool.
For this purpose, I’m looking for 2 main KPIs.
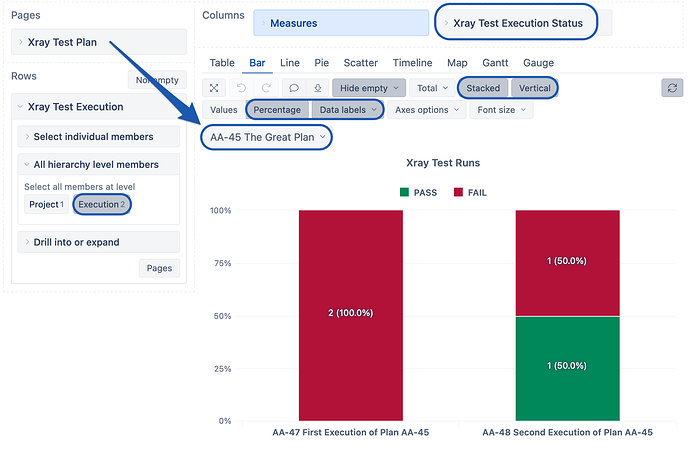
- Breakdown per test execution
A Test plan covers a new Firmware release to be delivered. This is done through a set of multiple Test Executions, covering different test stages/areas (also executed by separate teams in different locations) and different test environments.
To get a better understanding of our progress, I would like to present how the status is per test execution, in this test plan. This will help to understand where we’re on track, where we’re behind and where the risk areas are.
E.g. Test Plan TEST-100 exists out of Test Execution TEST-101, TEST-102,…, TEST 110
For each of these Executions I would like to see the execution status: PASS - TO DO - FAIL…
the result would give me a 10 stacked bars (one for each Test execution), presenting the status.
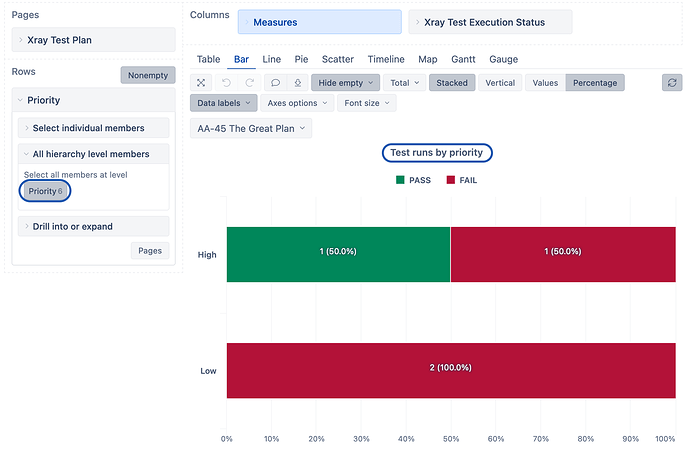
- Execution status broken down on Test case Priority.
All our test cases have a priority, it would be good to have a view on progress per test case priority - it is valuable to know how much progress is being made on High priority vs low priority test cases.
Using the priority dimension will only result in the priority of the Test Execution, but not on the test cases part of these execution (which is in our case not a relevant KPI).
E.g. Test Plan 100 with 5000 scheduled tests: stacked bars per priority
P1 priority - 250 PASS - 1 FAIL - 3 TO Do
P2 priority - 750 PASS - 15 FAIL - 580 To Do …

