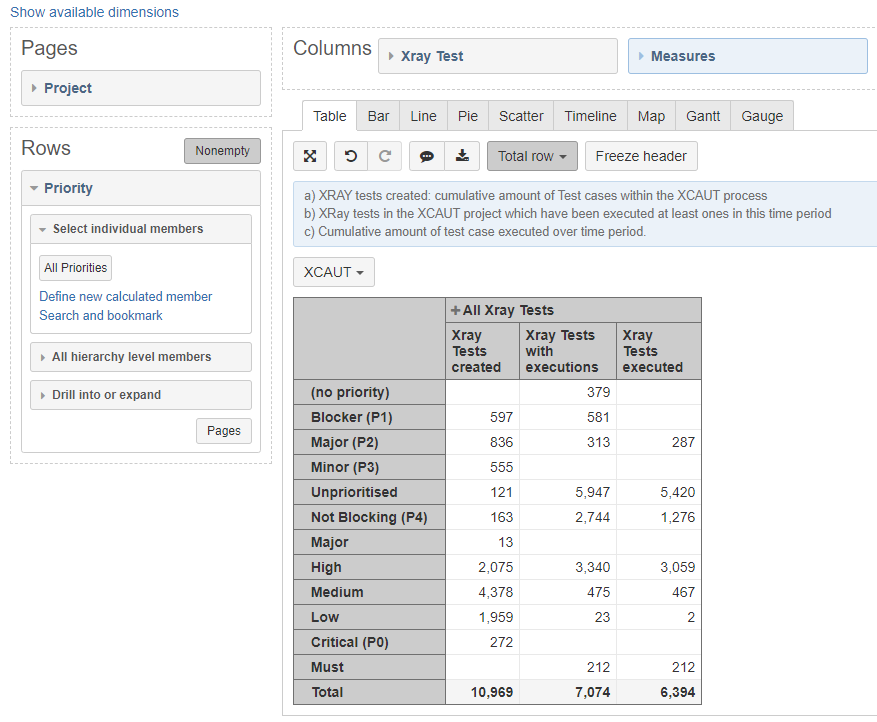
To understand how we’ve been managing our test case repository and how well our test strategy has been implemented, I would like to present a set of KPIs, of which the following high level KPI (managed through XRay, within Jira):
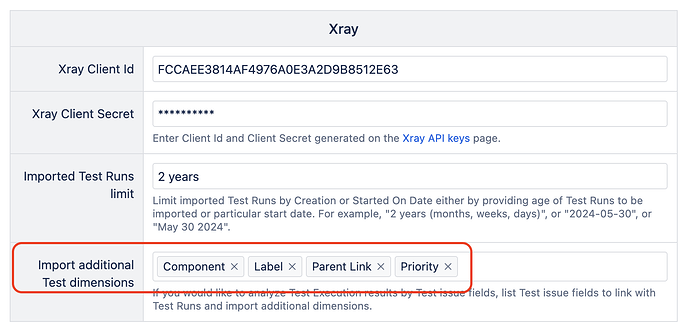
(background: for test case scheduling, we have assigned a priority to the individual tests - though we’re working on some clean-up of this priority as we’re facing a mixed use of priority fields)
Scope:
a) Present the amount of available test cases within the repository, mapped against their priority
b) Once this mapping is in place, present a split between the tests which have at least executed once and the ones which have never been executed.
Approach:
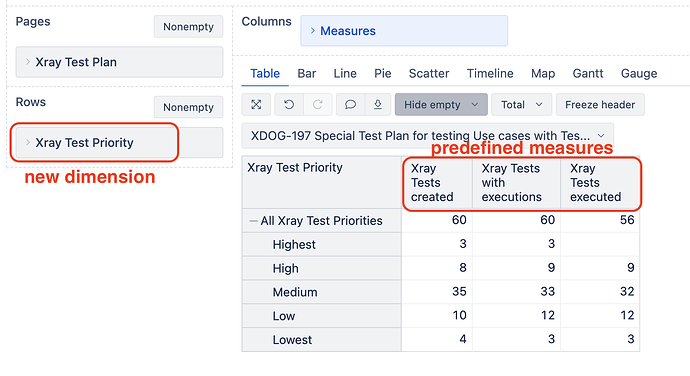
- It’s rather straight forward to get the amount of tests created (Issuetype Test) and map them against priority
- According the documentation I could use either “XRay Tests executed” or “XRay Tests with Executions”, it seems the latter one would be the best choice for us.
- With these statistics I can easily created a calculated measure to count the tests which have never been part of an execution.
However, when creating this table I get some numbers which doesn’t match up - to explain the problem I’ve added both fields “XRay tests executed” and “XRay tests with execution”
- For some of the priorities I have more tests with an execution than there are actual tests created (though according the documentation a test would be calculated only once, even when present in multiple executions)
- Furthermore, when checking the totals I get to a sum which doesn’t seem to match the values of the rows above - but on the other side, it could be this total is closer to the actual state than what I can see on the priority breakdown.
Any clue what I’m overlooking here, and any guidance whether my attempt is the best way forward to present such a KPI?


