Hi @all
i’m trying to get the following metric:
The sum of Xray Tests in a Testset over the time and the number of the issues in status FAIL, PASS, TODO at this time.
So that i can see the trend of my testset over the time.
Columns are: Time | Issues in Testset | Issues PASS | Issues FAIL | Issues TODO
Do you have any idea? I tried with some calculations but didn’t get the right solution.
Greetings Mirco
Hi @MircoGabriel,
For this report, you might want to use Xray specific dimensions and measures (here is documentation with more details: Xray Test Management).
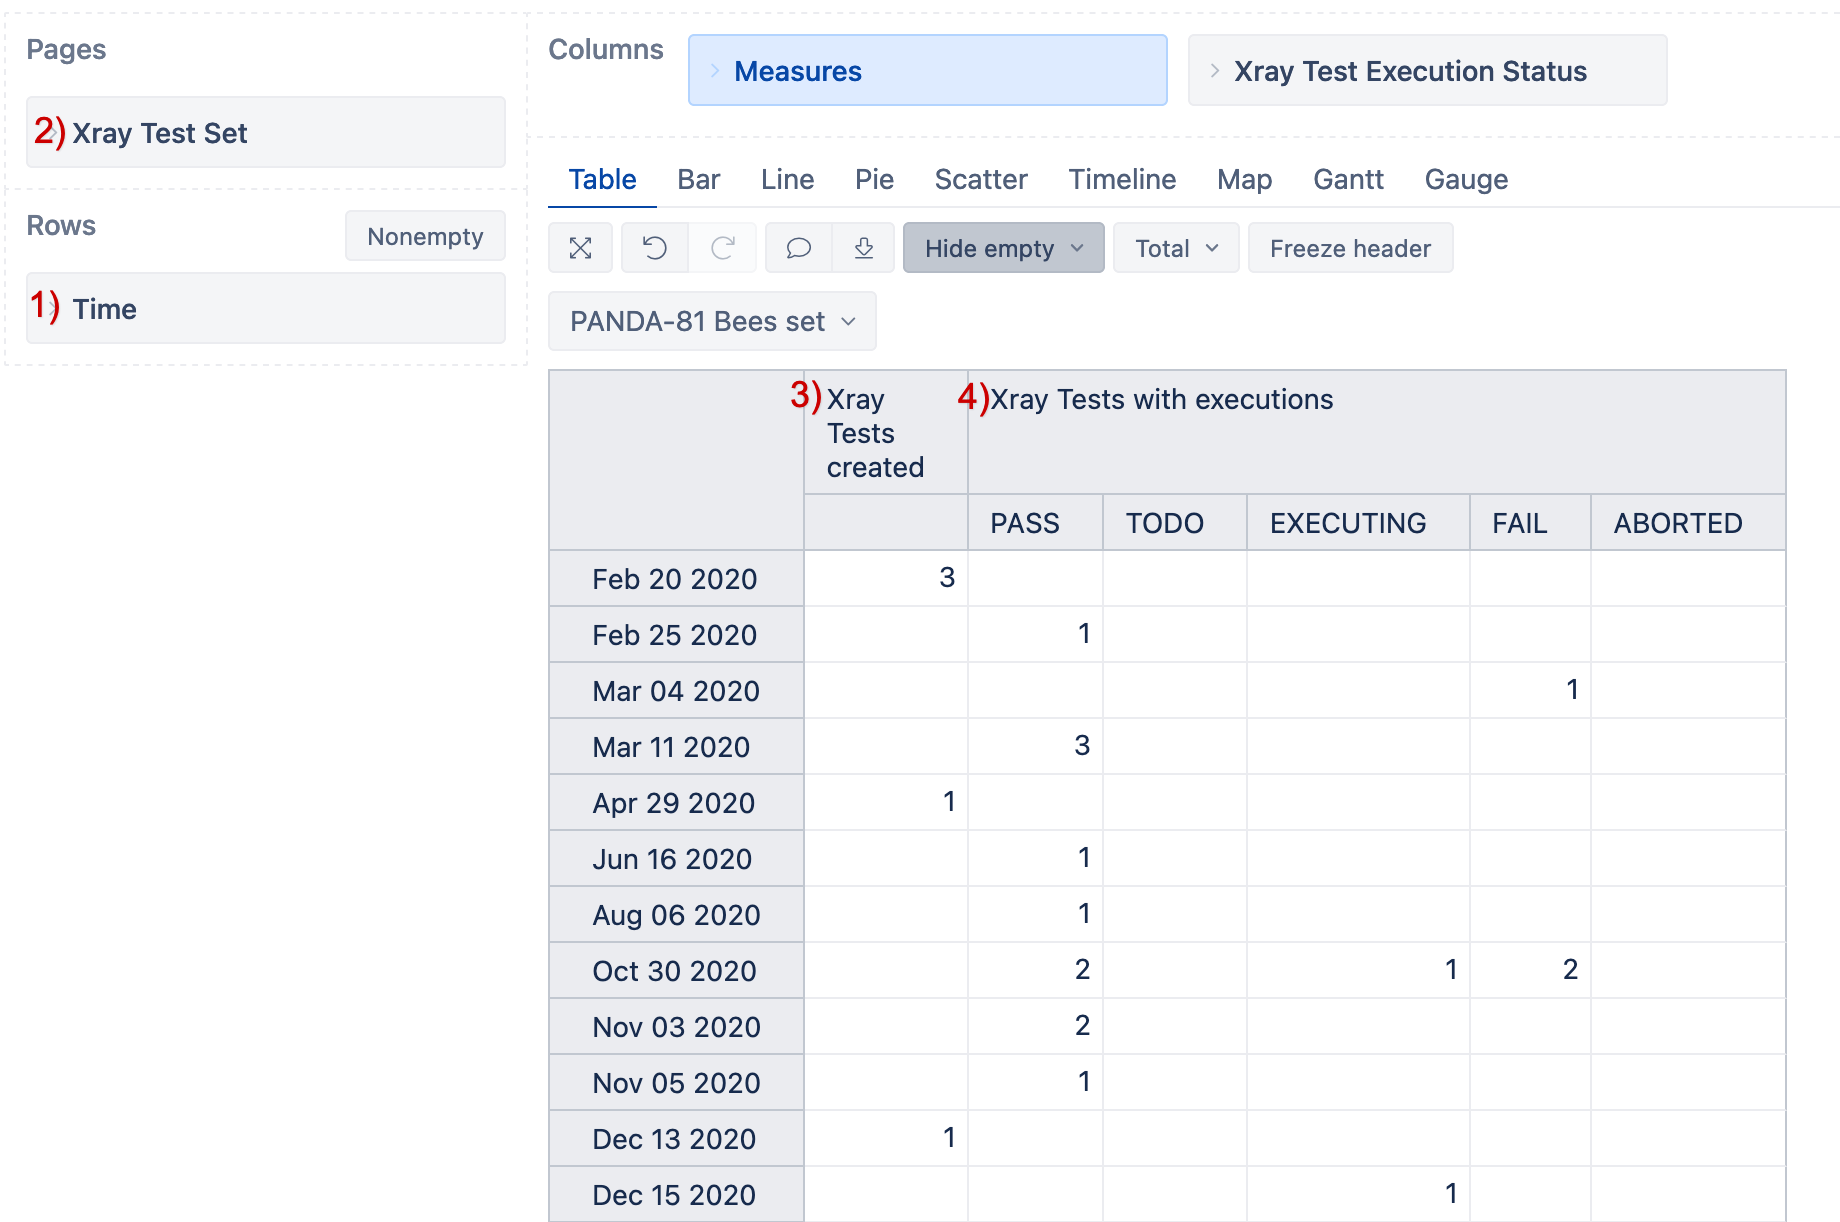
You might start with this setup:
- Move “Time” dimension on report rows.
- Move “Xray Test Set” dimension on report pages to filter data by Test Set.
- Select measure “Xray Tests created” on columns to see how many tests are created for the test set on each day.
- Select measure “Xray Testss with executions” on columns to see how many tests are executed each day. Then click on the measure header and choose the option Drill into → Xray → Xray Test Execution Status to split tests by their statuses (more details on Drill into described here: Create reports).
The initial report might look like this:
Best,
Zane / support@eazyBI.com