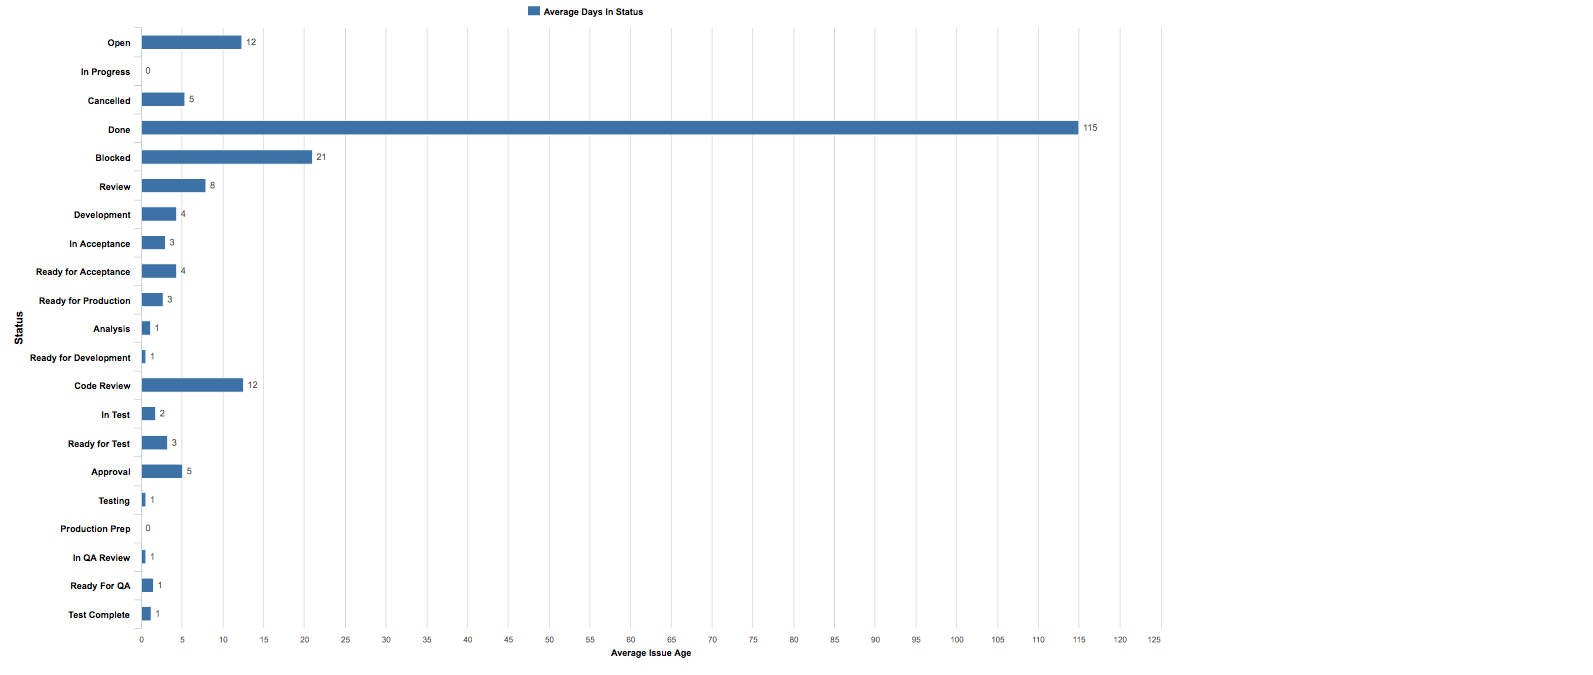
Have a report that shows Average Days in Status and want to order how the status are presented in the report
I have tried
Aggregate({
[Transition Status].[Transition Status].Members,
[Transition Status].[Done],
[Transition Status].[Cancelled]
})
but only get a total not a list of the status
Hi @briantaylor,
You are on the right track. To order transition statuses, you can define a new calculated member using function Aggregate().
Your formula has a redundant line, which should be removed:
[Transition Status].[Transition Status].Members
For more details, see this topic and short instruction video How to change order of columns and rows in the report?
Best,
Zane / support@eazyBI.com
Zane
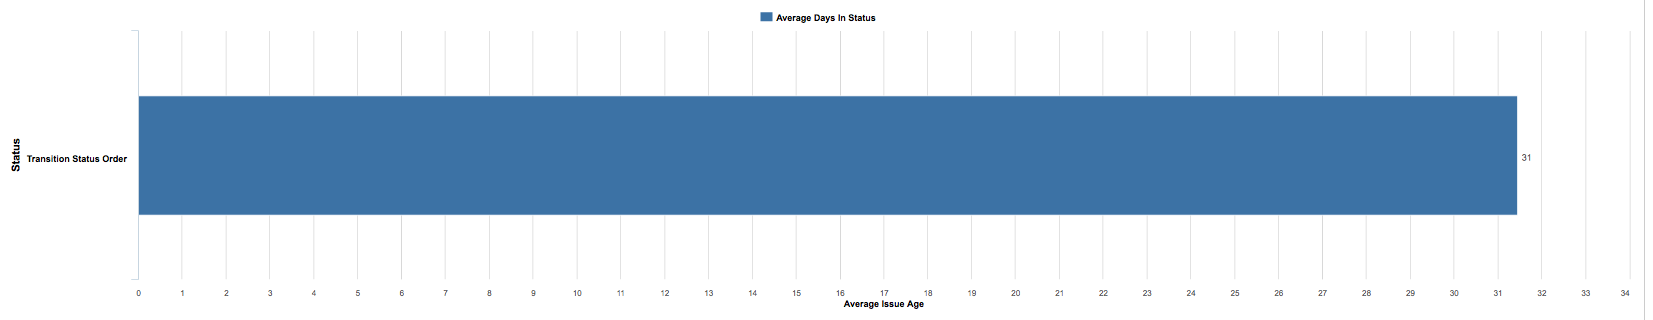
I have the following
Aggregate({
[Transition Status].[Done],
[Transition Status].[Cancelled]
})
but still only get a single line not a list of just the aggregated issues
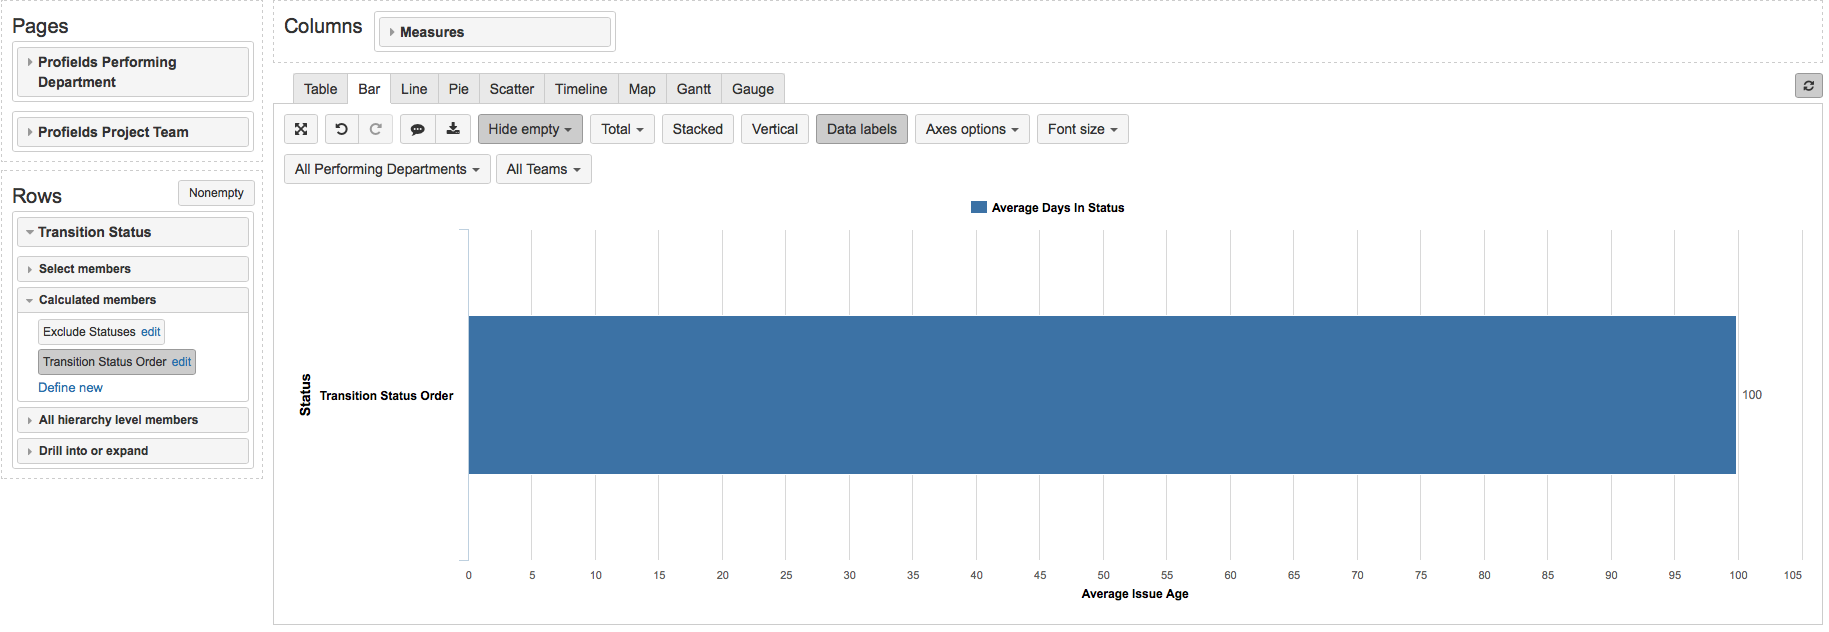
@briantaylor you see only one bar chart because you have not expanded the aggregated member “Transition Status Order” to see transition statues it is composed.
- Switch to the Table view
- Expand “Transition Status Order”
- Remove “Transition Status Order”
- Switch back to the Bar view.
On topic How to change order of columns and rows in the report? is a short GIF showing how to do this.