Angle up or down a trendline to form a cone of uncertainty on a burn-up chart

Hello EazyBi Forum,

Long time reader, first time poster here.
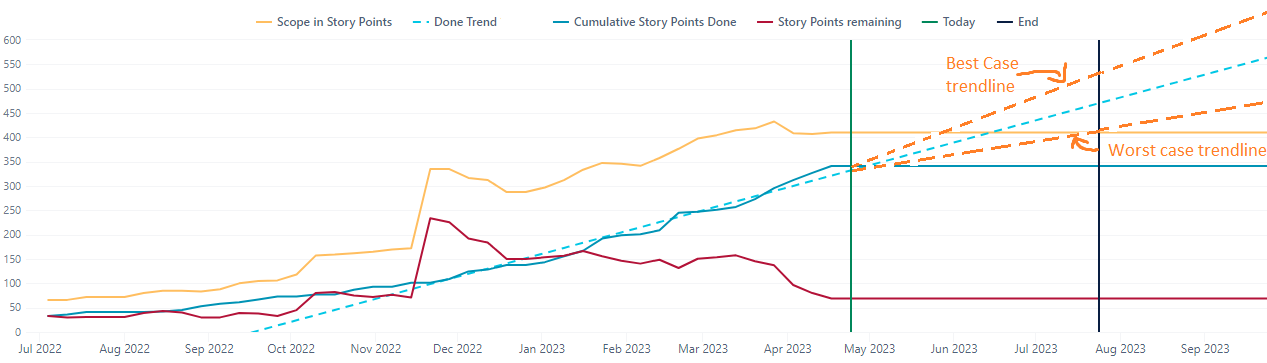
I’m trying to create a cone of uncertainty to see a best case or worst case scenario and the impact it has on my burn-up chart.

The following is what I’m trying to do:

My Story points done trend line is a measure I made using the following input:

Cache(
LinRegPoint(
DateToTimeStamp([Time].CurrentHierarchyMember.StartDate),
Filter(
[Time].CurrentHierarchyMember.Level.Members,
DateBetween([Time].CurrentHierarchyMember.StartDate,
‘6 months ago’,‘Now’)
),
[Measures].[Cumulative Story Points Done],
DateToTimeStamp([Time].CurrentHierarchyMember.StartDate)
)
)

I was hoping to see what would happen if starting at the Today mark my teams would ramp up their velocity by 20% by putting in overtime for example.
Anyone have any advice on how to do this?

Kind regards

1 Like

You can adapt this awnser to get what you want!

1 Like

Hi @Stef,
Congrats on your first post :wave:

I see that @SoTh already has provided the answer that could work for you.

Additionally, to that I wanted to share this eazyBI report from our Demo account that also has prediction measures (“Project prediction low”, “Project prediction high”) for low or high probability - Project Prediction report - Issues - Jira Demo - eazyBI

best,
Gerda // support@eazybi.com