I want to create a report that includes Cycle Time and Lead Time. I am having the hardest time creating this report and could use a lot of help. I am new to easyBI and just can’t wrap my head around creating this report.
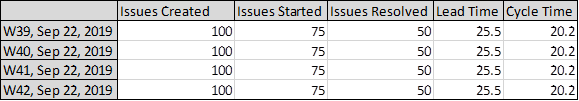
Basically what I want is a report that looks like this:
Issues Created = total number of issues created within the specified week
Issues Started = total number of issues that transitioned into the “In Progress” status
Issues Resolved = total number of issues transitioned into the “Done” status
Lead Time = average time it takes from creating an issue to completing an issue
Cycle Time = average time it takes from starting an issue to completing an issue
I need to know the Lead Time which would be from, in my case “Open” to “Done”.
I also need to know the Cycle Time which would be from, in my case “In Progress” to “Done”.
Any help with creating this report would be greatly appreciated.
You would put the Time Weekly hierarchy on rows. Note that there is a dynamic calculation of the Last 4 weeks available that you can select and drill into to always see the latest four weeks.
Then, about the Measures (you can read more about the below measures in the same above link):
Issues created - groups issues on Time by their creation date. So this would show how many issues are created within the specific week.
Issues started - you can get this by combining ‘Transitions to status issue count’ and In Progress transition status. See more about these measures here
(
[Measures].[Transitions to status issues count],
[Transition Status].[In Progress]
)
Issues resolved - default eazyBI issues resolved measure counts how many issues are resolved on the date within the period (a week in this case). Resolution by default can happen with different status transitions, so the condition is when the resolved status and resolution is set. If instead, you are interested in transitions to a particular status, you can use the same logic as in the ‘Issues started’ measure above
Lead Time - If the above Issues resolved is the correct measure you are looking for, then yes, here you could use the Average resolution days . This calculation is described in the above documentation link as well, but briefly - for the issues that have the resolution date on the date within the period, this calculates days between created and resolved date (total resolution days) and divides this with resolved issues to get the average.
Cycle Time - For this, you can use the logic I described in the previous mail. This would require to first create an Aggregate(…) calculated member in Transition Status dimension that would include all the Cycle statuses (for the sake of example, let’s assume this is the name of the calculated member in Transition status dimension with following formula):