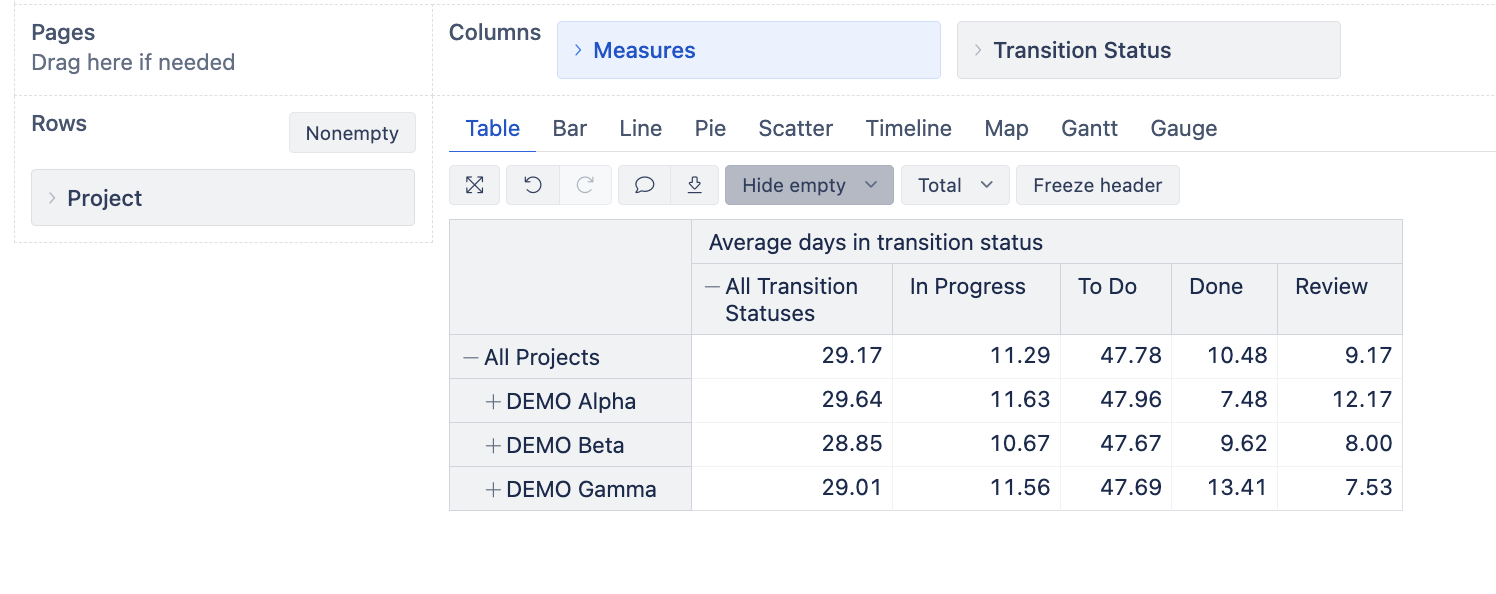
Hi everyone, I’m trying to build a report that tells me how long the tickets have spent in their lifecycle (from funnel to done), in each phase.
I am currently using “Average days in current status” but unfortunately the numbers only refer to the current tickets in the current phases.
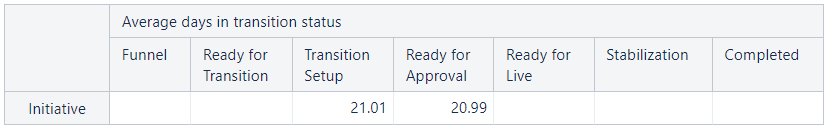
-- Average days in transition status and days since last transition
AVG(
  Filter(
    Descendants([Issue].CurrentMember, [Issue].[Issue]),
    -- for unresolved issues only
    IsEmpty([Issue].CurrentHierarchyMember.Get("Resolved at")) AND
    IIF([Transition status].CurrentHierarchyMember.Level.Name = "Transition Status",
        [Transition status].CurrentHierarchyMember.Name = [Measures].[Issue status], 1) AND
    IIF([Status].CurrentHierarchyMember.Level.Name = "Status",
        [Status].CurrentHierarchyMember.Name = [Measures].[Issue status], 1)
  ),
  -- Total days calculation (both in transition and since last transition)
  IIF(
    [Status].CurrentHierarchyMember.Level.Name = "Status" and Not [Transition Status].CurrentHierarchyMember.Level.name = "Transition Status",
      ([Measures].[Days in transition status],
       [Transition Status].[Transition status].GetMemberByKey(
          [Status].CurrentHierarchyMember.Key
      )),
      [Measures].[Days in transition status]
  ) +
  NonZero(
    CASE WHEN
    [Measures].[Issues history] > 0
    THEN
    DateDiffDays(
      [Measures].[Issue status updated date],
      Now()
    )
    END
  )
)
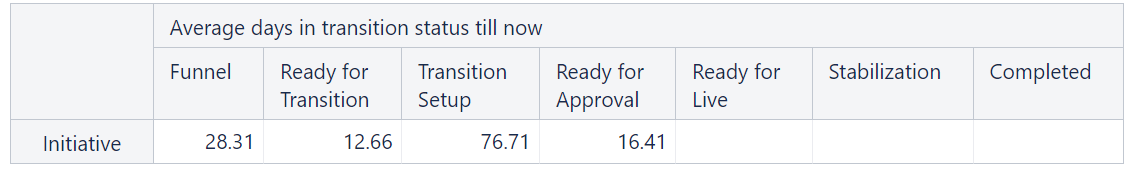
But what I am interested in is the answer to the question - If I look at all the tickets that existed, how long did they spend on average in which phase/status?
So if I look at one ticket that has run through completely, I want to know how long the issue was in each status on average (also in the status funnel, which is not recognized as a transition status).
This will be visualized in a bar chart with statuses on the X-Axis and average days on Y-Axis.