Hi EazyBI team!
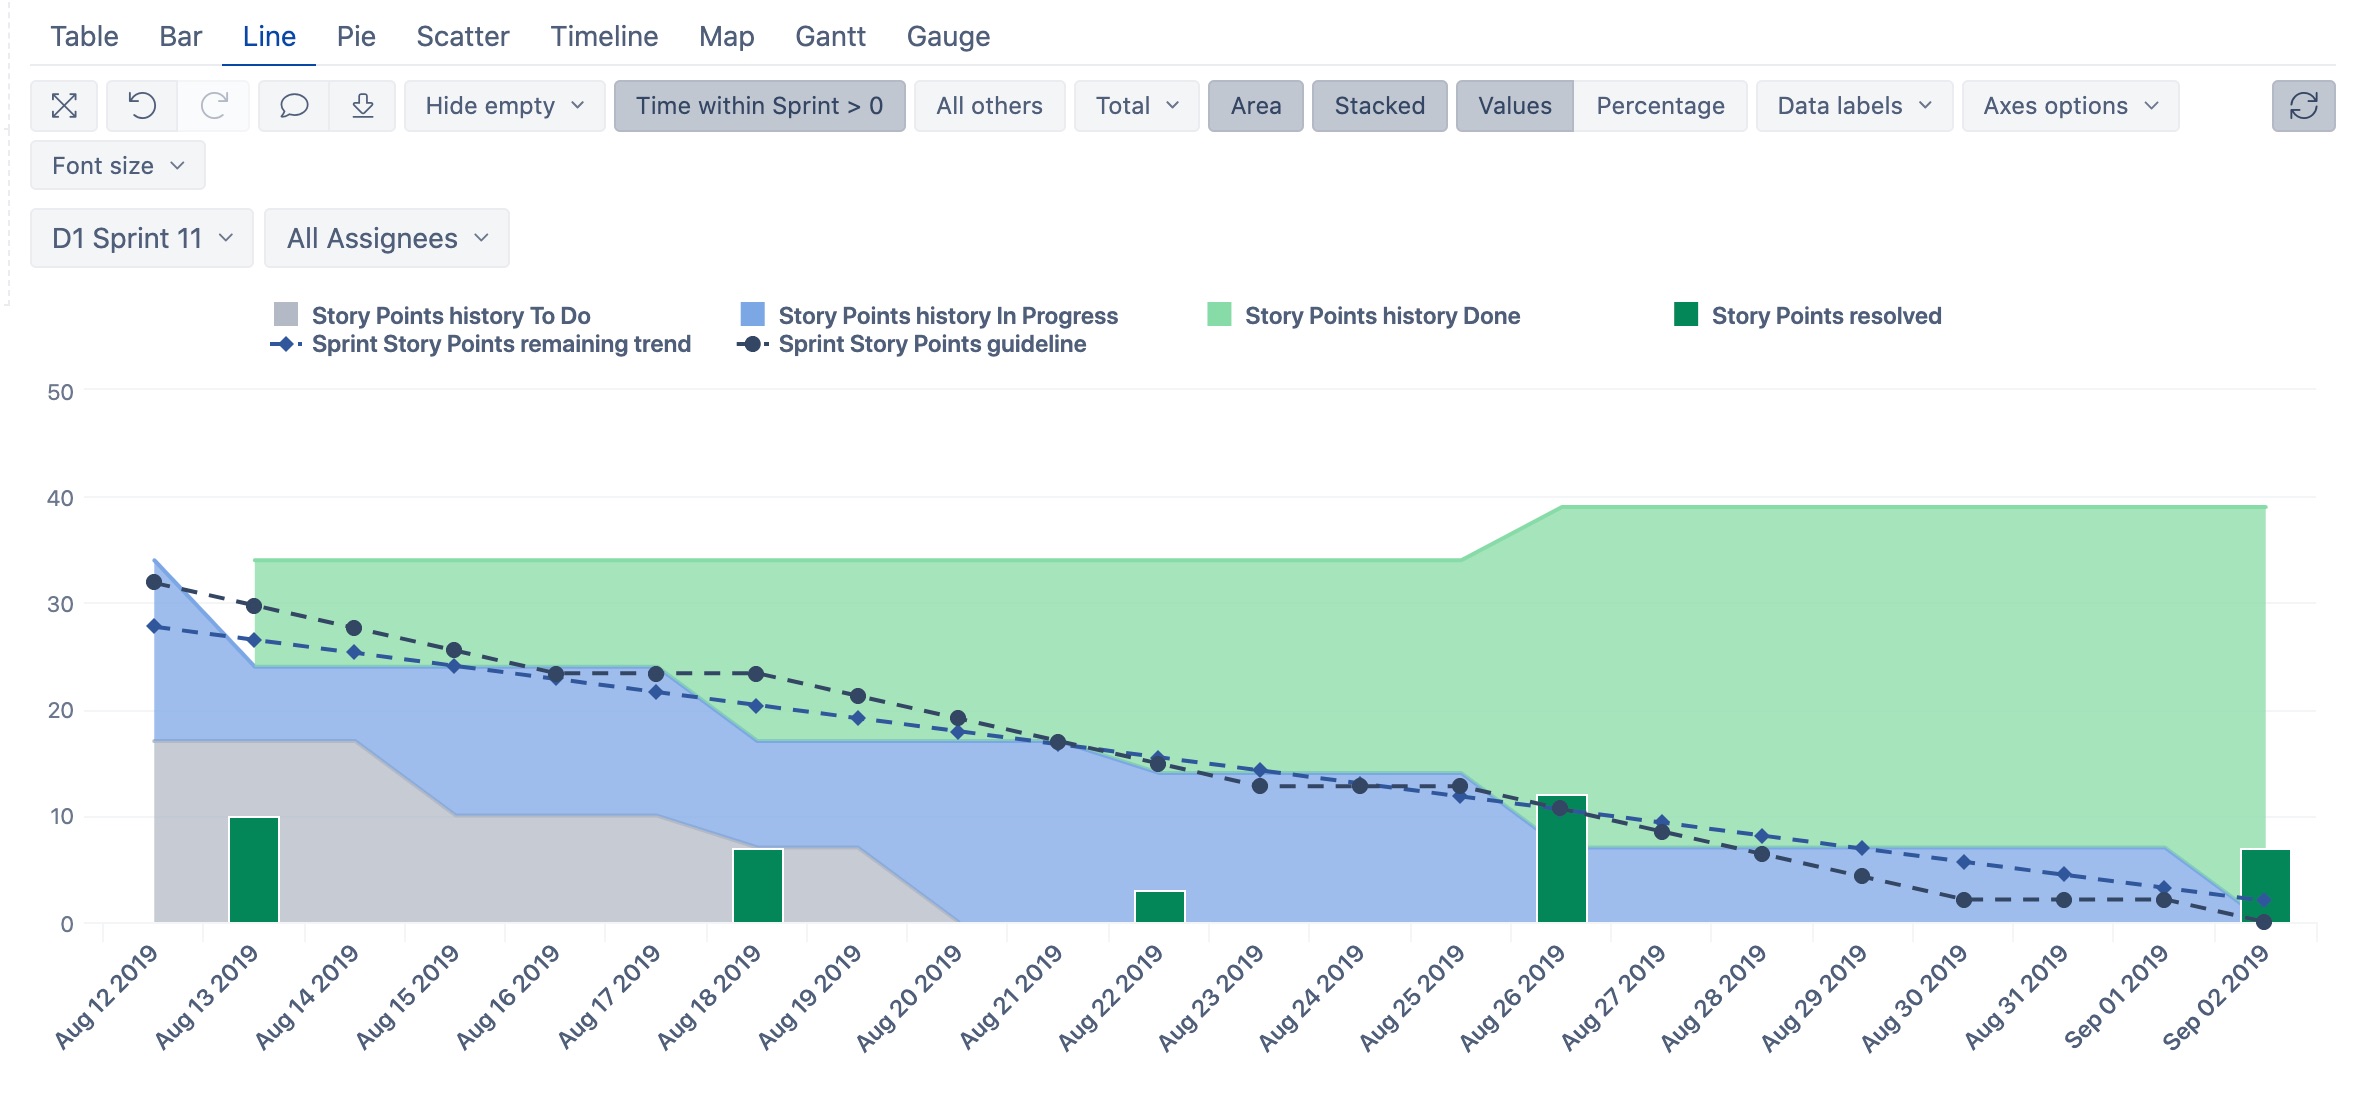
Me and my team are using the Burn Down Chart proposed in EazyBI documentation. The chart looks great and we’ve been leveraging it for some projects.
There’s an issue though that I think some MDX knowledge would be able to easily solve. Since the burn down chart counts Story Points Resolved only when they’re actually brought across the finish line, it’s hard to see the Day by Day progress with the Story Points.
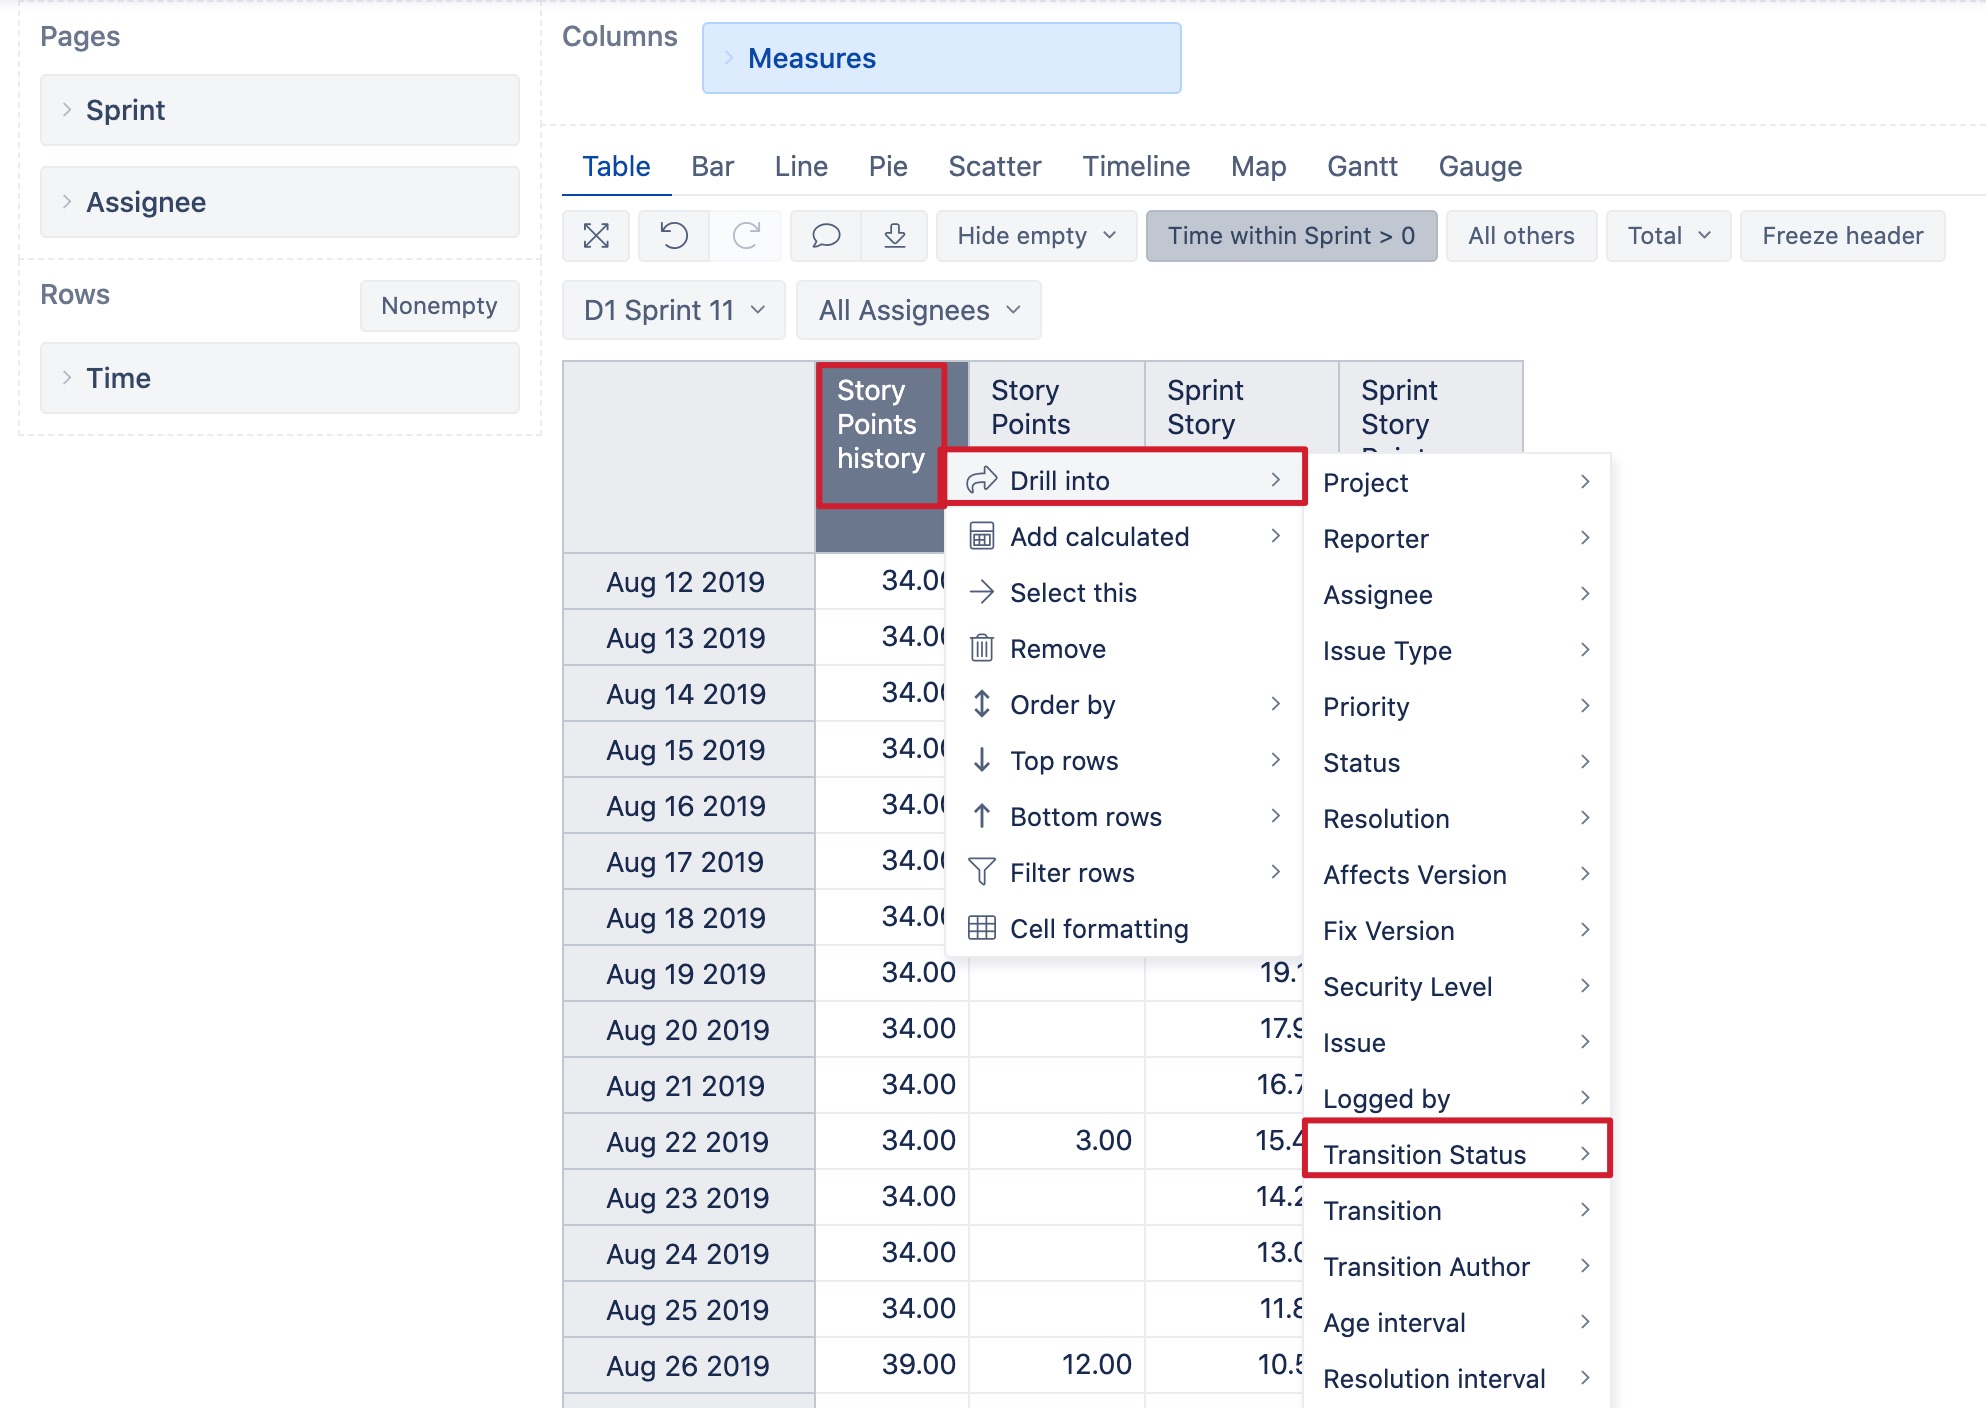
The question is: would it be possible to create a logic by which every time a Story is moved into a different Status (“Open”, “To do”, “In Progress”…), the amount of story points resolved slightly increases by a predefined portion of the total story points assigned?
I can give a quick example: If a Story is moved from “To Do” into “Open”, a 20% of the Total Story Points assigned to it, it’s being shown as resolved. As well as if the same story if moved from “Open” into “In progress”, an increasing 20% of the total story points assigned to it, it’s being shown as resolved. The process goes on until the story reaches the “Done” Status and Estimated Story Points = Story Point Resolved.
Please, let me know if the ask makes sense and how this would be possible to be build without duplicating story points or showing too much progress compared to the actual.
Thank you!