Hello there!
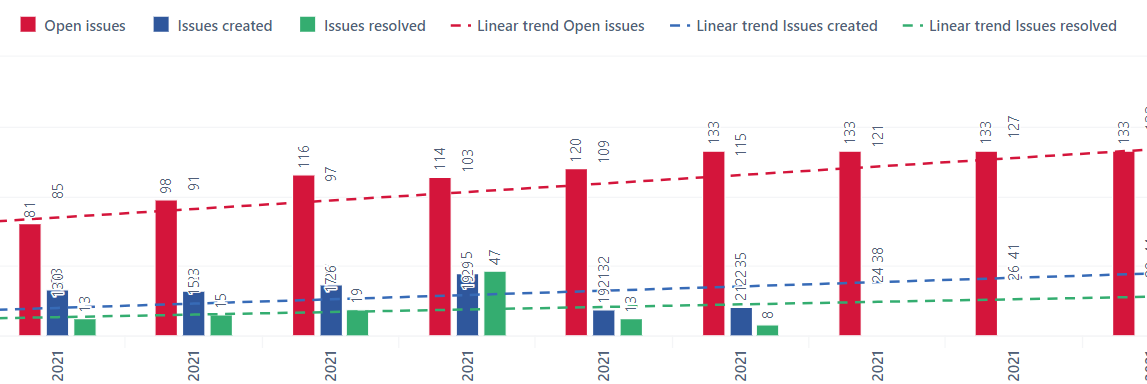
I created a chart with Bug inflow, outflow and currently opened bugs (weekly).
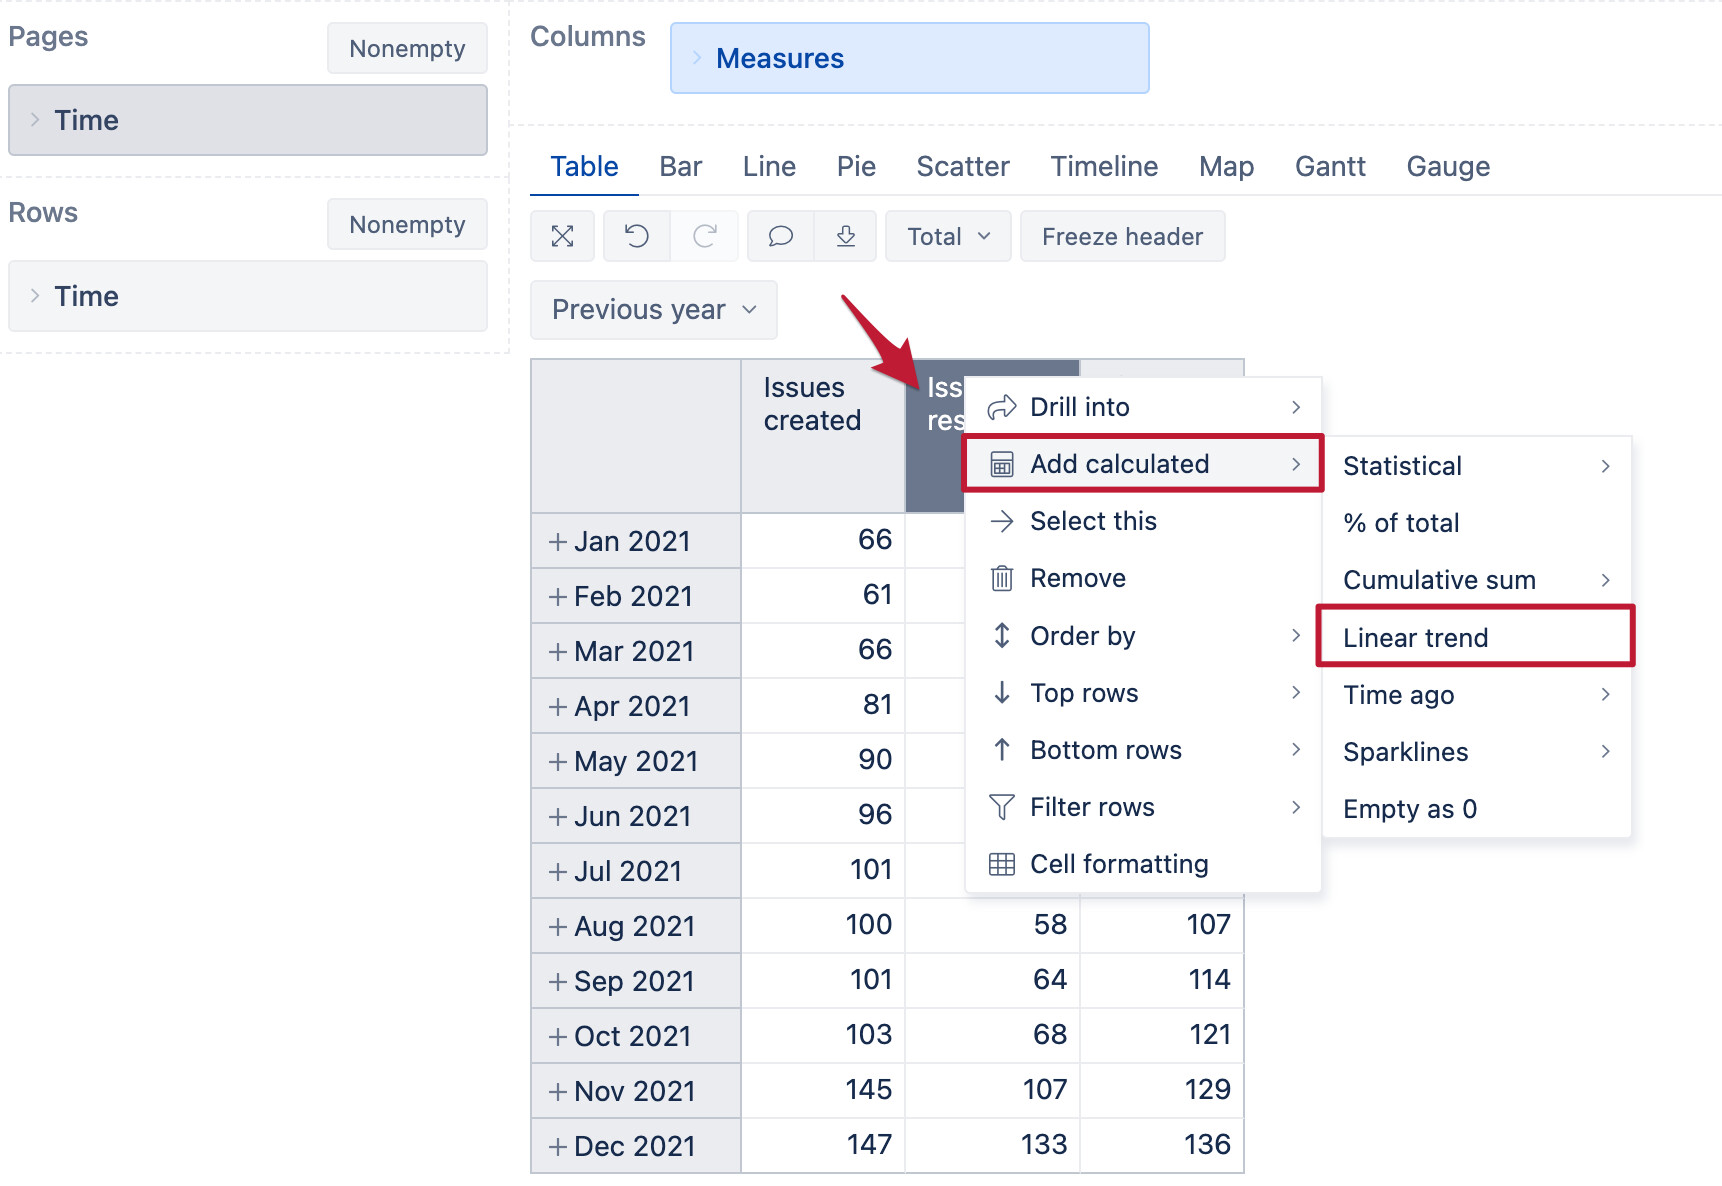
I also added linear trends for each metric.
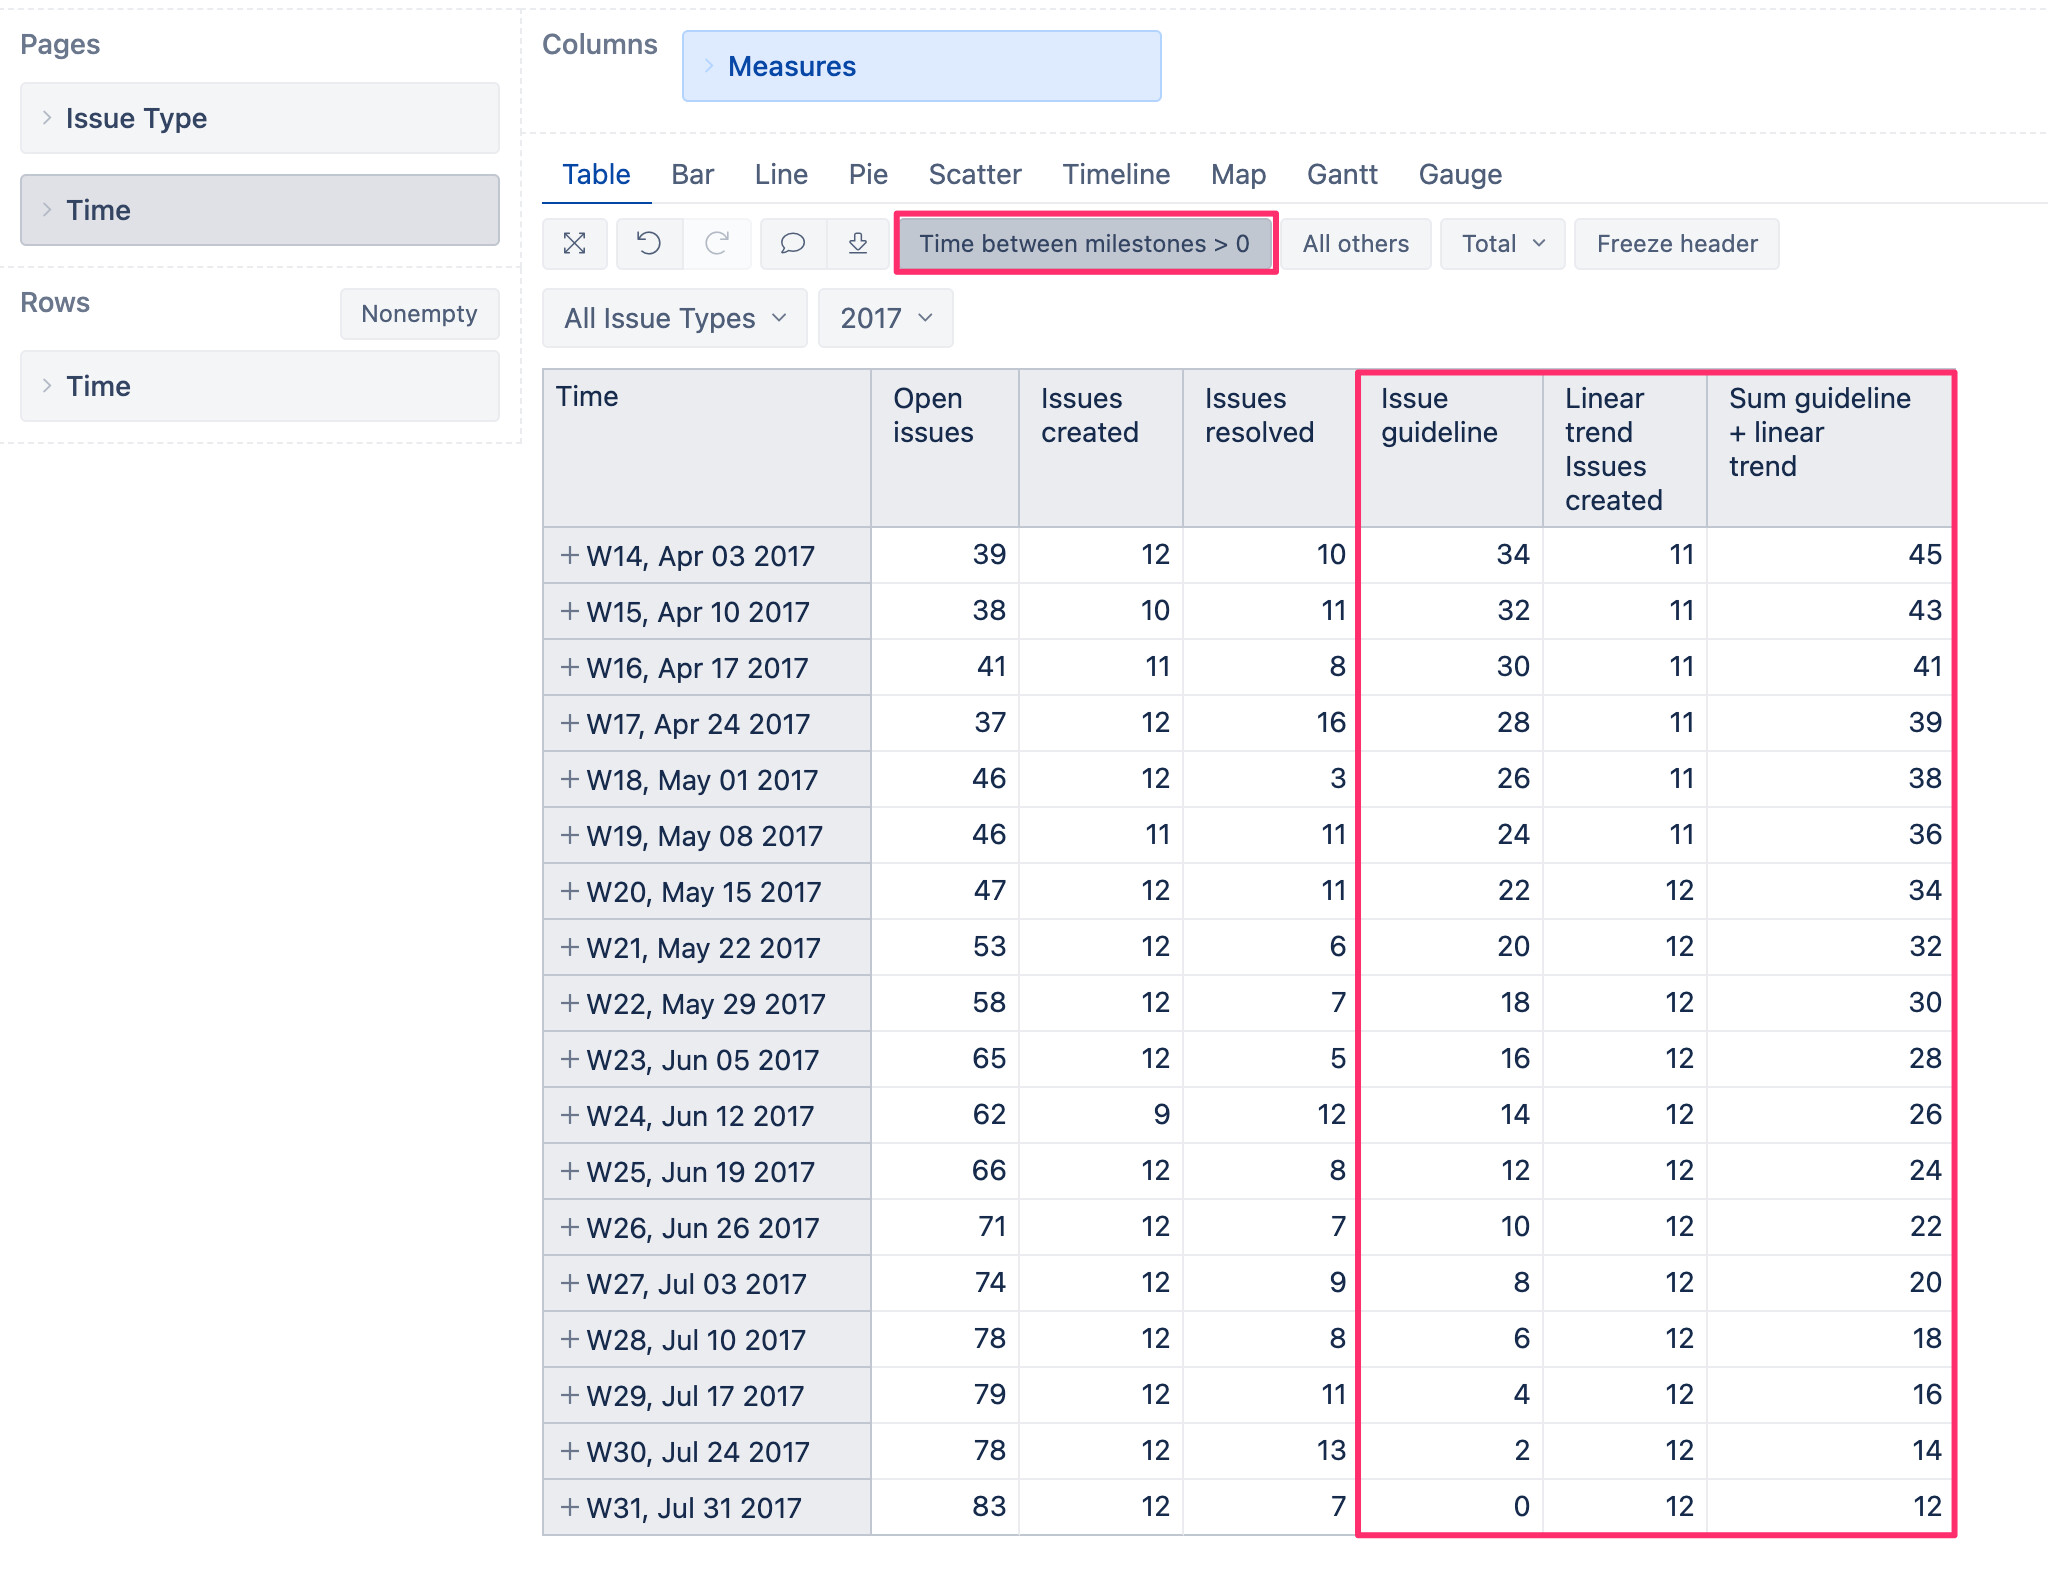
My intention is to create measures to calculate and set:
- To set milestone and limit of amount of opened for this milestone
- To calculate needed outflow (which will be based on currently opened bugs, inflow prediction and limit of amount of opened for milestone) for upcomming time periods (weekly in the future)
I assume for Inflow prediction could be used linear trend for inflow (but maybe somebody can propose better way).
I assume calculation should be based on some ideal outflow and take into account possible changes in inflow.
Simple example to describe my idea:
Case #1 (simple):
- We have 100 opened bugs and all testing activities are finished (inflow = 0)
- We need to fix it till milestone which will happened in 10 weeks.
Decision: we need fix 100/10=10 bugs per week
Case #2 (my):
- We have 100 opened bugs
- We have inflow=10 bugs per week which grows (+2 bugs per week)
- We need to fix it till milestone which will happened in 10 weeks.
Decision: - Find linear trend value for inflow for next week as a prediction
- Add this inflo to ideal outflow for currently opened bugs which is equal 100/10=10 bugs per week
- So outflow for next week should be (10+2)+10 = 22
But how calculate it for several weeks in the future and how to do this with eazyBI, this is a kind of unknown and very hard task for me.
I’ll be appreciated for any help!