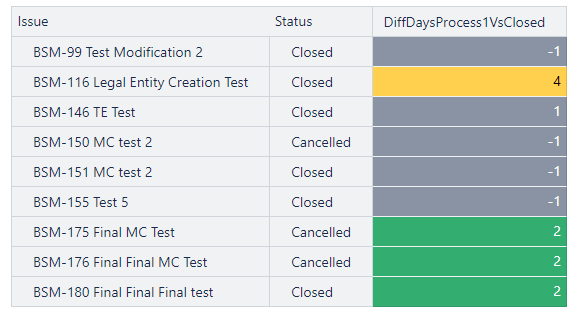
i have the above table and want to count by the value of the measure DiffDaysProcess1VsClosed. as we can see there 1 value with the number 4 (represent number od days, the difference between 2 dates).
3 number 2
to get a table that show issue count per status for those value measure.
expected result
Status / count / Value(days)
Cancelled / 2 / 2days
Closed / 1 / 2days
Closed / 1 / 4days
etc…
Any ideas to get that result
There are two optiosn for creating a histogram report.
One option is to create a calculated measure (in Measures) for each value group – a separate calculated measure for “1 day”, another calcauted measure for “2 days”, and so forth. Each of those calculations woudl iterate through all issues using the function Descendants(), and for each issue, check the duration of “DiffDaysProcess1VsClosed”.
Here are more details on calculated measures and set expressions: Calculated measures.
Another option is to precalculate the “DiffDaysProcess1VsClosed” during data import using a calculated custom field. And import this value as measures and also as dimension, allowing to group issues by the value: New calculated fields.
Here is a Community post on similar topic: How to create a histogram.