Hello,
I have a simple table (dimension, measure) and I want to create a histogram of values on the measure, to understand data distribution.
Any ideas?
Thanks
Hello,
I have a simple table (dimension, measure) and I want to create a histogram of values on the measure, to understand data distribution.
Any ideas?
Thanks
Hello David,
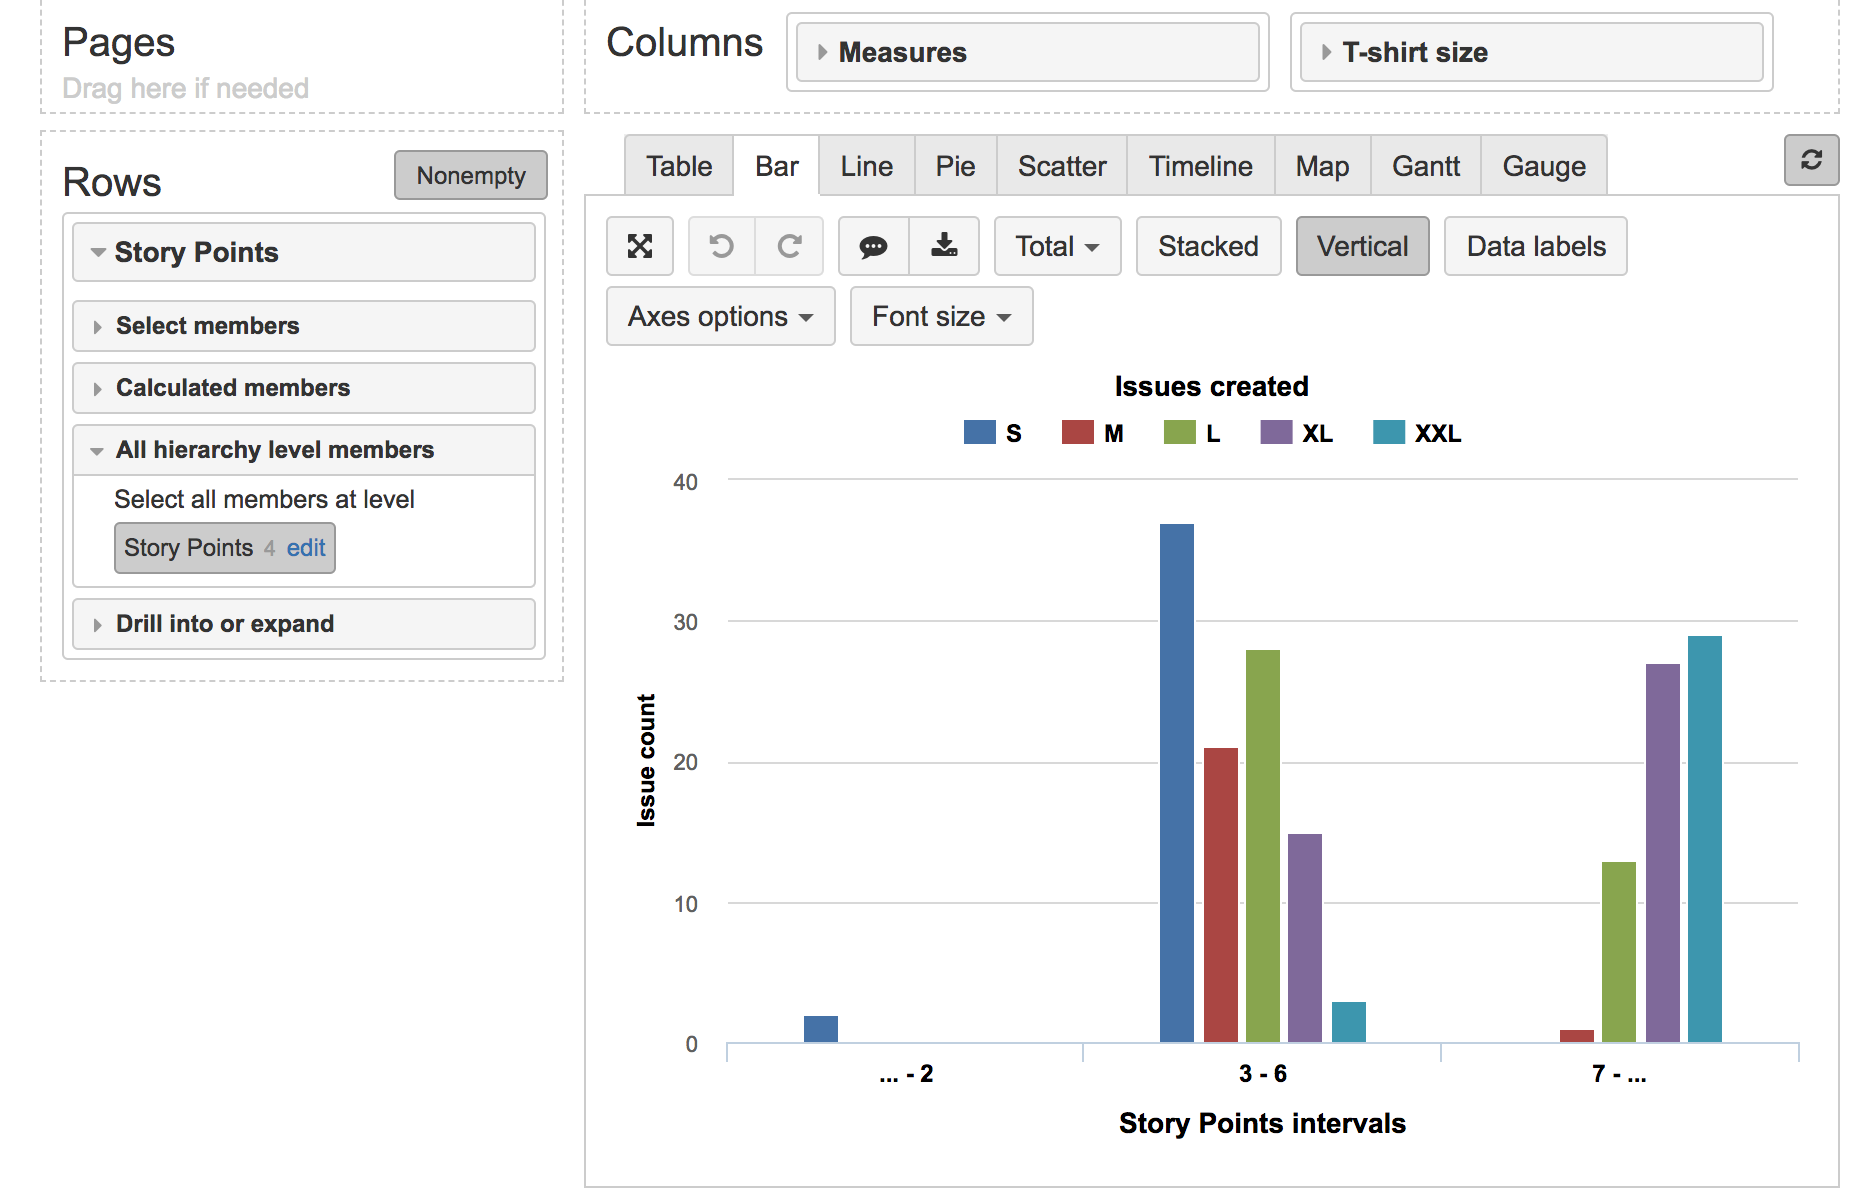
eazyBI by default imports any numeric value as a measure you will get total value from this custom field. Histogram chart should represent a count of issues with particular numeric value and split by another dimension.
You would like to import your numeric custom field as a dimension or interval dimension into eazyBI to see how issues are split by particular values.
Here is an example custom field definition that enables importing this custom field as a dimension (interval dimension):
[jira.customfield_NNNNN]
data_type = "integer"
measure = true
dimension = true
intervals = "/10"
Please update the definition above using custom field ID instead of NNNNN.
The last line intervals = “/10” will create this dimension as an interval dimension with step 10. Please remove the line if you would like to split data by exact custom field values.
Please see more information about intervals though:
https://docs.eazybi.com/display/EAZYBI/Interval+dimensions
Then you can build a chart with this new numeric/interval dimension and your another dimension together with default measure Issues created. This will show you how issues are distributed by this numeric custom field and another custom field dimension.
In my example, I imported Story Points as interval dimension with step “3,7”. I used this new Story Points dimension and T-Shirt Size dimension to see a distribution of data.
Daina / support@eazybi.com
Hello Diana,
I am looking for something similar, but with the issue resolution time as the intervals.
So Issue count as in your screenshot and the intervals are for example something like 0-10 days, 11-20 days, 21-30 days etc.
How could that be achieved?
Even nicer would be a histogram with the density instead of issue count, so like between 0 and 1 and for example 0,5 at interval 11-20 would mean 50% of all issues have a resolution time between 11 and 20 days.
But assume that is harder or maybe not possible?
Big thank you in advance.
BR, Markus
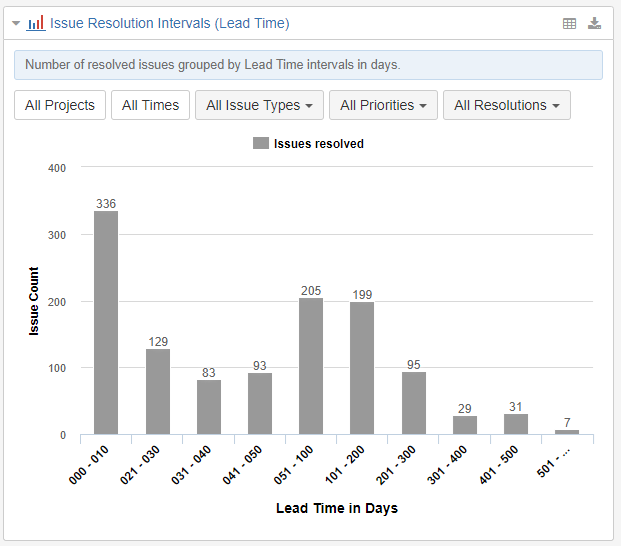
eazyBI has a default Resolution interval dimension. The dimension is not imported automatically, you would like to select it for an import explicitly.
Here are a couple of reports in our demo account using Resolution interval dimension:
Issue Resolution Intervals (Lead Time)
Issue Resolution Days (Lead Time)
Daina / support@eazybi.com
Hello Diana,
waow that is really great, thank you very much.
I took the Issue Resolution Intervals (Lead Time) - it works really good.
One question:
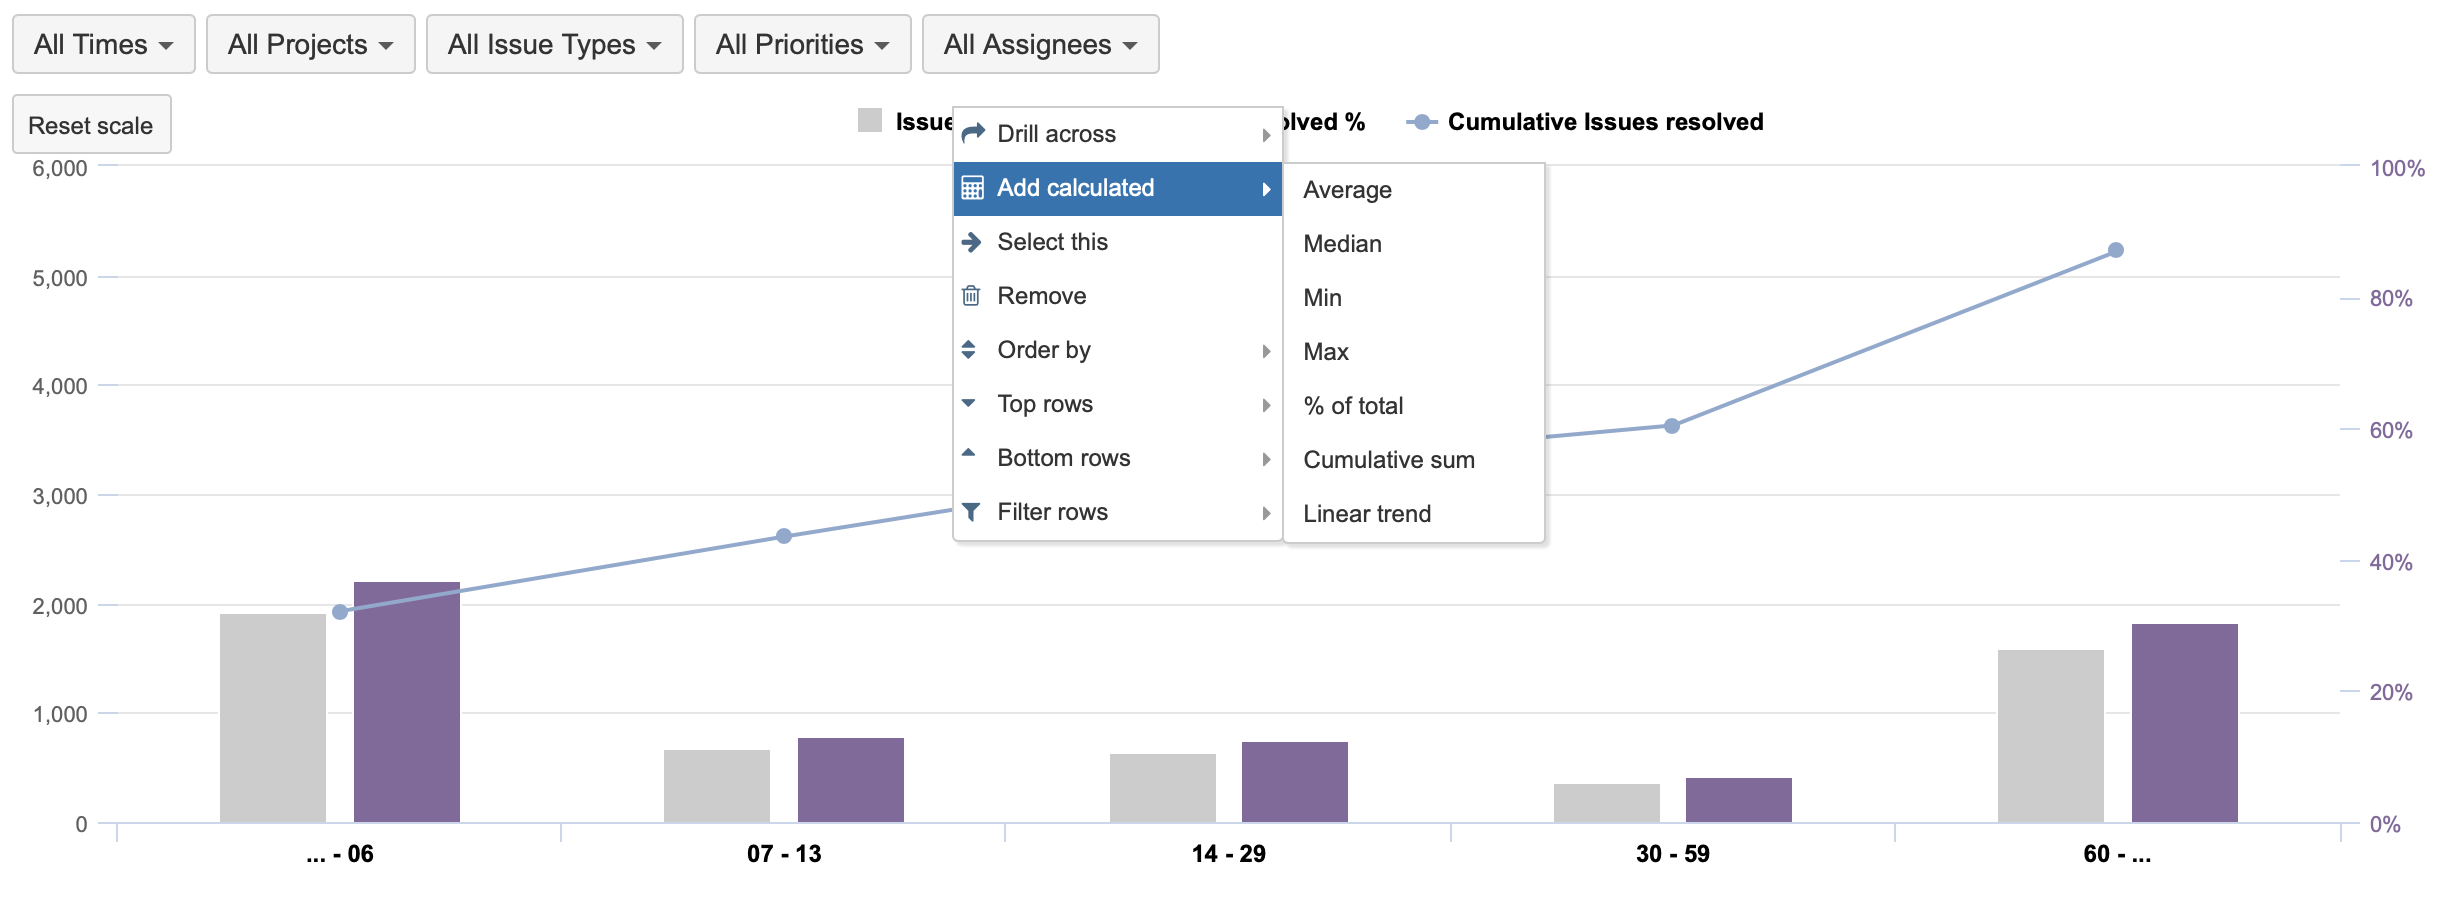
Is there a way to create a measure that shows the percentagte of issues resolved (similar to the issue resolved count)?
So something like
[Measures].[Issues resolved] /
…? And this would maybe be something like sum issues resolved of all resolution time intervals? or maybe there is a better way?
Best regards,
Markus
Edit:
Or is it maybe possible with a second cumulative line like this?:
https://images.app.goo.gl/gAHCX2fawP55iawRA
Hi Diana,
not sure if I created the two replies in the correct tree.
Do you maybe have a short feedback on the additional question?
That would be great, even if it is not possible would help, then we at least know for sure.
Big thank you in advance.
Best regards,
Markus
Since eazyBI version 5.0, we added an option to Add calculated measures. In this case, you can add a % of total to see % of each Cumulative sum as well.
Daina / support@eazybi.com
Hello Diana,
that is great thank you very much.
A good reason to upgrade as soon as possible for us (at the moment we are on 4.7.2)
Thank you again.
Best regards,
Markus
Hello Daina,
Is there any way to have single dates in the X-axis instead of intervals?
Thanks in advance,
Javier.
You can use Time dimension in the report instead of the interval dimension on Rows. This will give you an overview on how many issues were created/resolved over time. We have a default sample report Created vs resolved issues over time. Here is a description on how to build the report.
Daina / support@eazybi.com
@daina.tupule ,
i also have this difficult.
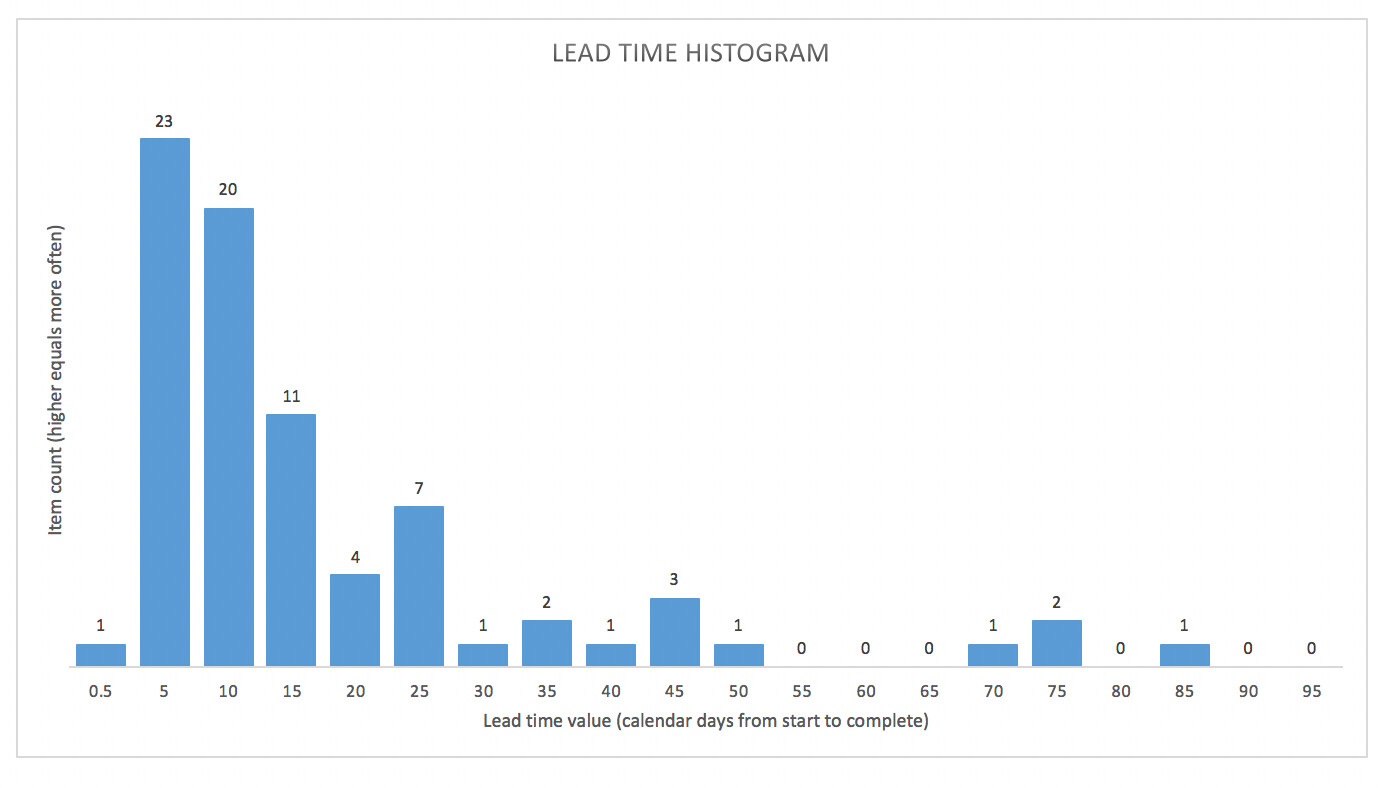
for example, i would like to, instead of using intervals, use amount of days that is the same as lead time. Here’s an example of histogram that i need:
The explanation will be, for example, that we have 1 issue that we spend 0,5 days to be completed, 23 issues that we spend 5 days, and so on…
The goal is to create percentiles based on this values…
While eazyBI does not have the option to use intervals for 0.5 days in combination with 5 days step, could you consider using intervals 1 day and then 5 day step 1,5-200/5
We show values as intervals, though.
… - 000 will represent issues that were resolved within a day
001 - 004 will represent issues that were resolved within 5 days etc.
Here lead time distribution report example in our demo account:
https://eazybi.com/accounts/1000/cubes/Issues/reports/621687-lead-time-distribution
Here is another report based on intervals that show vertical lines in particular percentiles:
https://eazybi.com/accounts/1000/cubes/Issues/reports/559656-monte-carlo-chart-resolution-days
Daina / support@eazybi.com
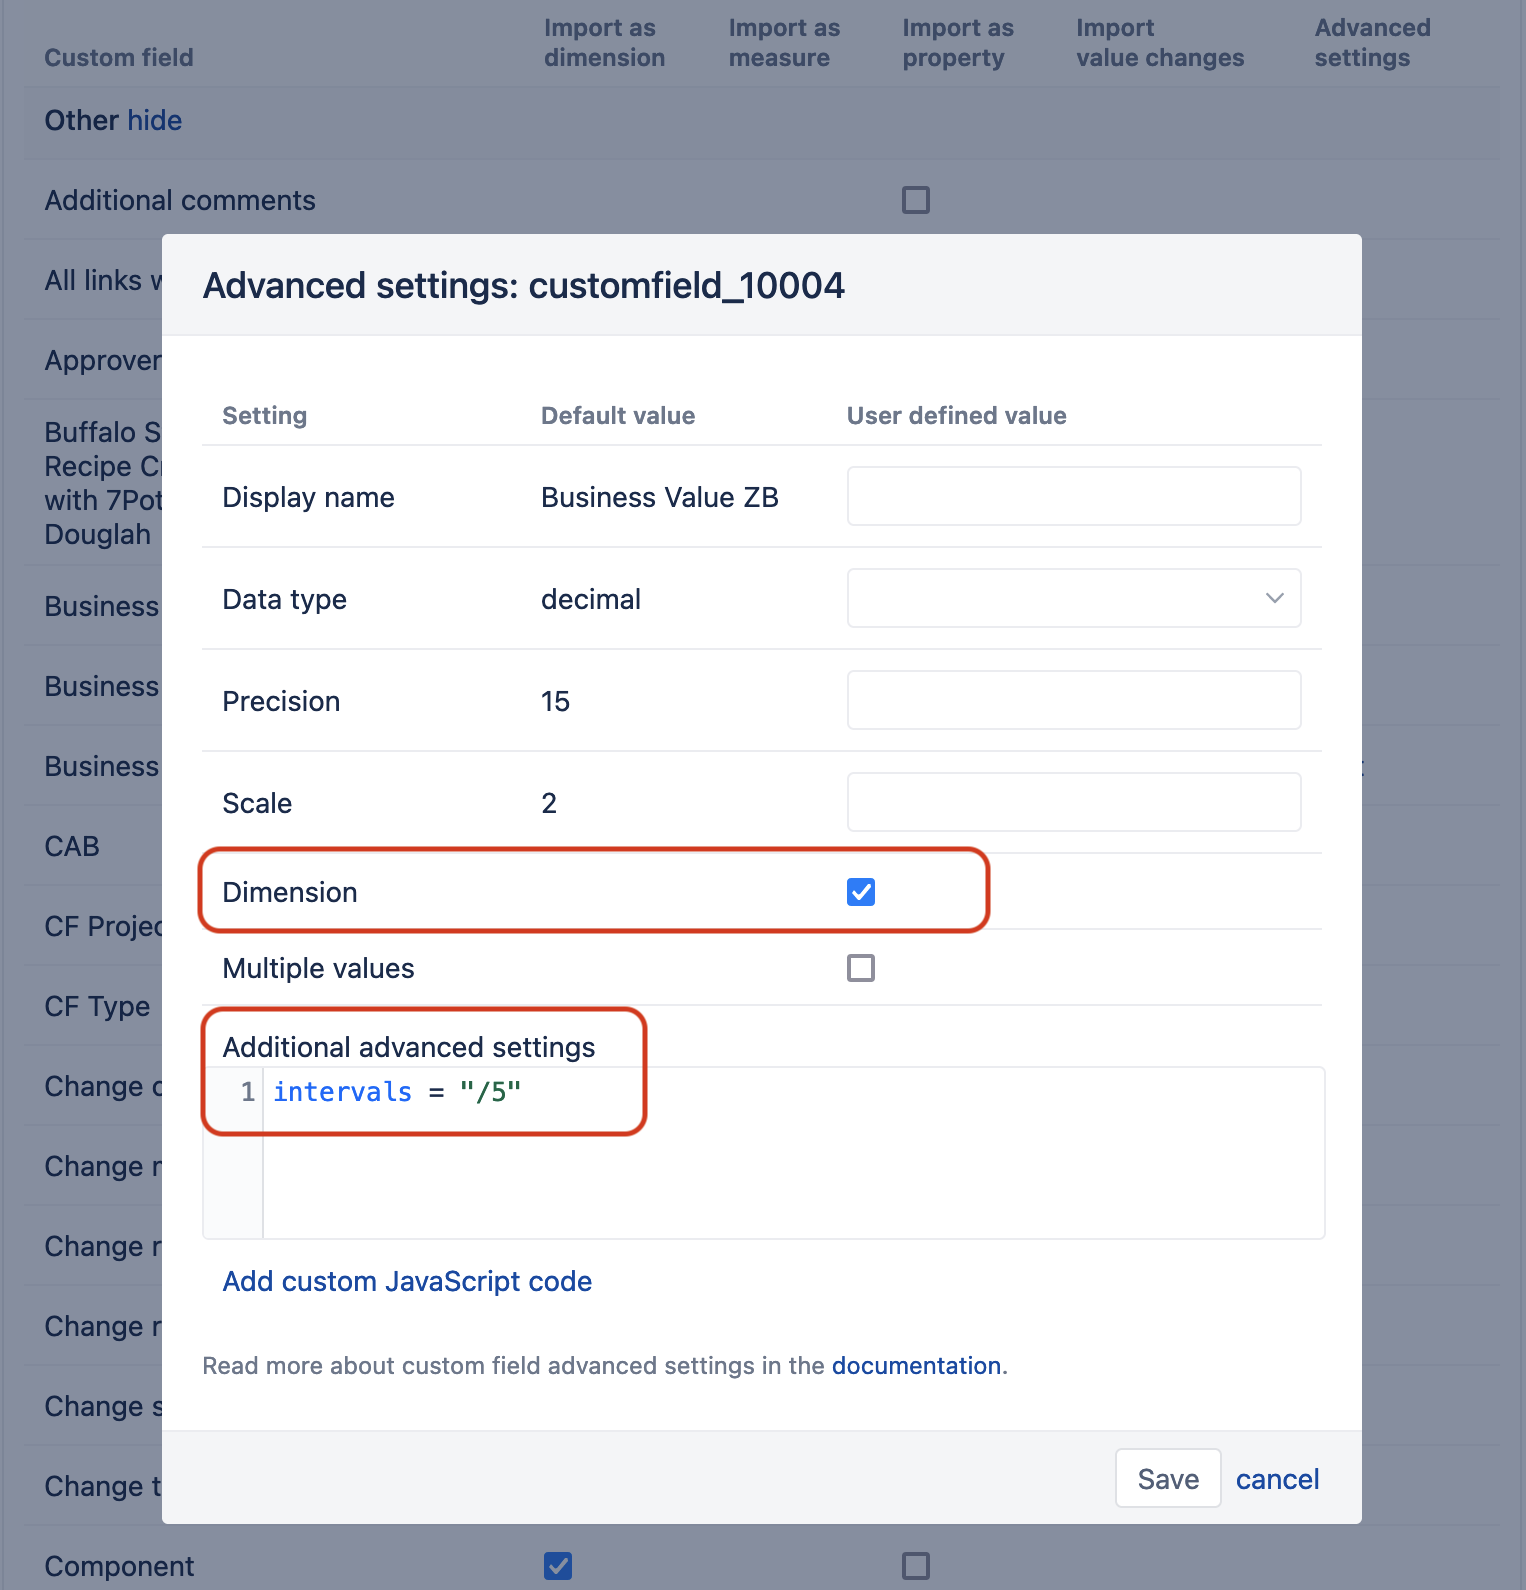
This post des desrbes how you can import numeric fields as dimensions or interval dimensions to see how issues are grouped by individually assigned values.
And since eazyBI verion 6.6 and on Cloud, this solution is more approchable, eazyBi account Owner, user admin or Data admin can create those dimension form the Jira Import options without disturbing Jira administrator.
Find the numeric cutom field in import options and Edit its advanced setting (see the documentation
Custom field import options).
intervals = "/5"See also the example with Story Points in this Community post:
Best,
Zane / Support@eazyBI.com
Hi, those reports are blocked is it possible to share them again or unblock them pls ?
At least i dont have access to them
Hello,
The reports should be available in our demo account. Some are also described in our documentation. There could be some temporary problems to access them. I hope you have found them already.
Daina / support@eazybi.com