I am trying to create a report about “Jira Service Management”, the rows is SLA, the columns is Breached and Not breached count…
But I can’t find SLA from Dimensions,and can’t find examples from “Jira Service Management Demo”.
How can i do it?
I am so far from being an expert on eazyBI, but I will try to contribute what I know.
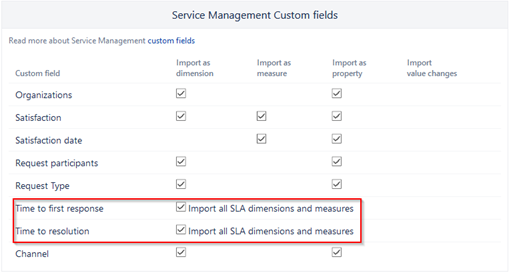
If you check the Service Management Custom fields section on data import, can find “dimensions and measures” from SLAs, but don’t specify which of them.
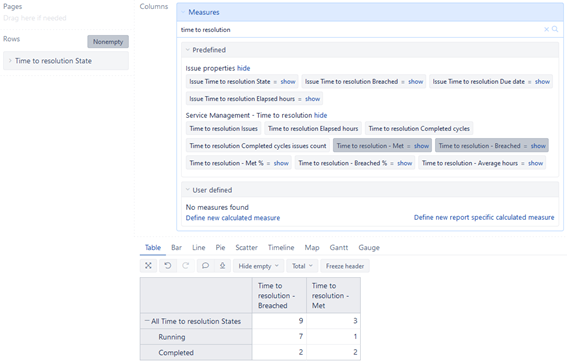
When lets view SLA’s dimensions can find Breached (none, Breached or Not Breached) and State (none, Running or Complete) dimension from each SLA.
I understand that you have something like this:
If you need the name of SLA like row, maybe you need to do some workaround with javascript, because the SLA’s dimensions are imported like properties of each one of that and can’t control it with the data importer. Sorry but I can’t help with that.
If you are searching for some examples maybe this can give you other ideas. Can use all that you need of each SLA on a dashboard to group results.
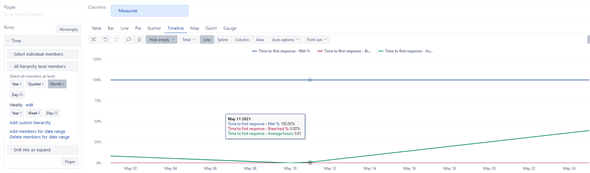
Time to first resolution: Percentages of Met and Breached per month (to see your team evolution result).
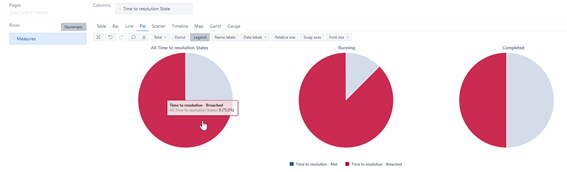
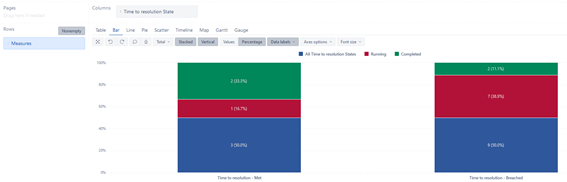
Time to resolution: Total Met and Breached per state (to see the total accomplish of an SLA).
*From bar view
If anyone has any ideas or recommendations about better practices for SLA reporting, I’d like to read those too.