Create a tabular report for gathering the list and amount of issues updated by a user in a period

Hi Community
Good morning /afternoon.
I would ask you help for gatherig a Tabular report that shows the following information:

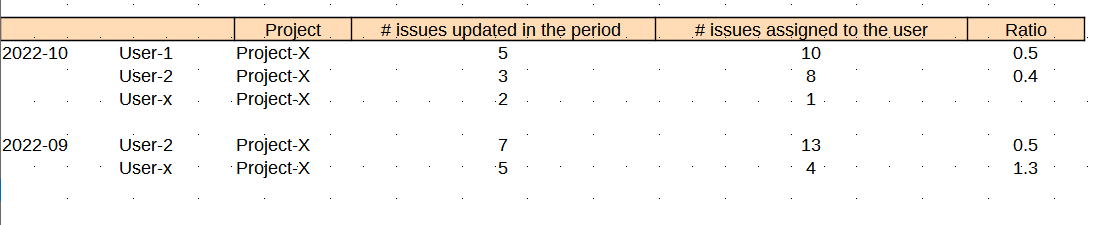
in essence, the idea is to be able to display how our people are making follow up on their assignements and also be able to gather a ratio 4/10, 5/20, etc.

Important: a) count only distinct issues in the period (in this case a monthly bases). It should not count more than one update onto the same issue within the period by assignee, only should be counting the last update date within the period. b) Also it is important that if the Default memeber is selected at Time dimension, the amounts should be added up consequently.

I was trying a lot of things but I need more experience (and help :frowning: ).

Many thanks upfront and sorry to bother you with this query. I am not an experience-user in EasyBi and MDX advance formulas.

Regards, Darío.

Hi,

There might be no complete solution for this use case, especially if you are on Jira Server or Datacenter. You can find a solution to a similar use case with a Javascript-calculated custom field in this community post: Count User interaction with Issue - #2 by Daniel_Luevano.

This Javascript code is designed for Jira Cloud. eazyBI for Jira Datacenter collects much less information about the issue change history, so the data will be incomplete. If you still try the solution on Datacenter, replace the accountID with the name in the code.

This solution gives the activity count in the period. An additional custom measures is needed to create a distinct issue count:

NonZero(Count(
  Filter(Descendants([Issue].CurrentMember,[Issue].[Issue]),
  [Measures].[Activity History]>0
  )
))

Kindly,
Janis, eazyBI support

I will check it Janis. Thank you very much.