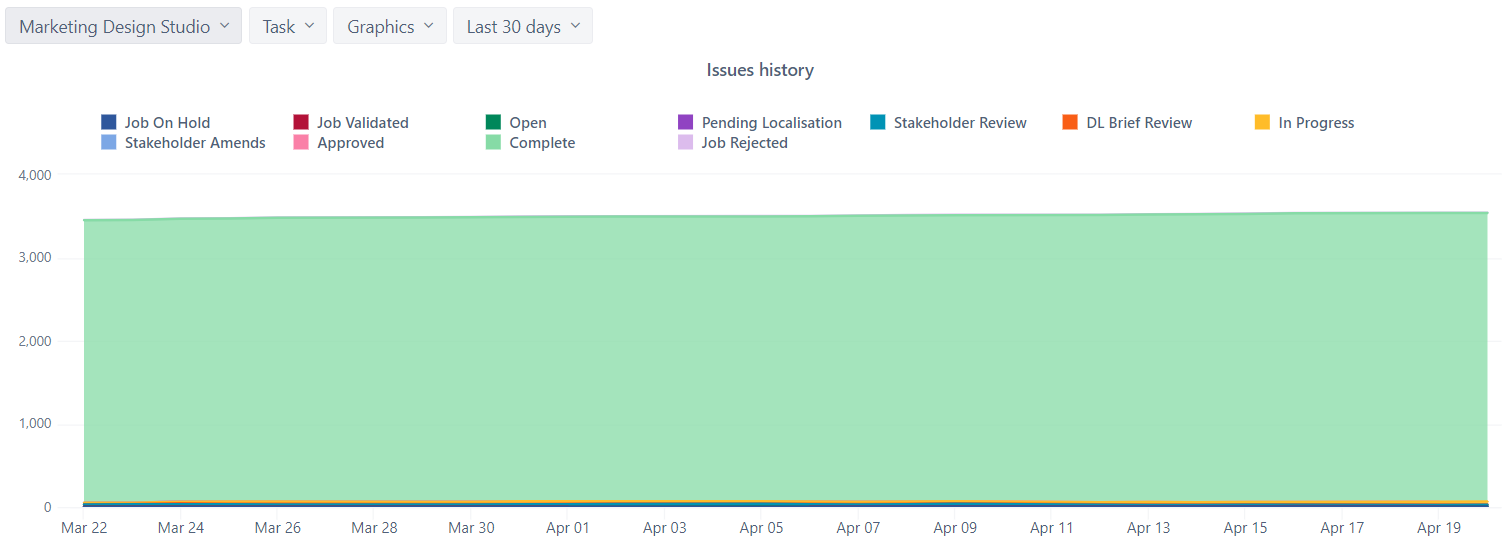
I have built a cumulative flow diagram for a project which is quite old and has a significant number of issues in complete which is making it hard to read the chart.
Is there any way to limit the ‘Complete’ issues to those which have been completed within the chart timeframe?
+1 for this question, I had a similar one some time ago.
Just filtering out the Completed ones (with a page filter) does not work, as then they are completely out, so also their history, when they have not been completed yet. And this changes how the CFD works in the first place.
So not sure, if there are more options since then.
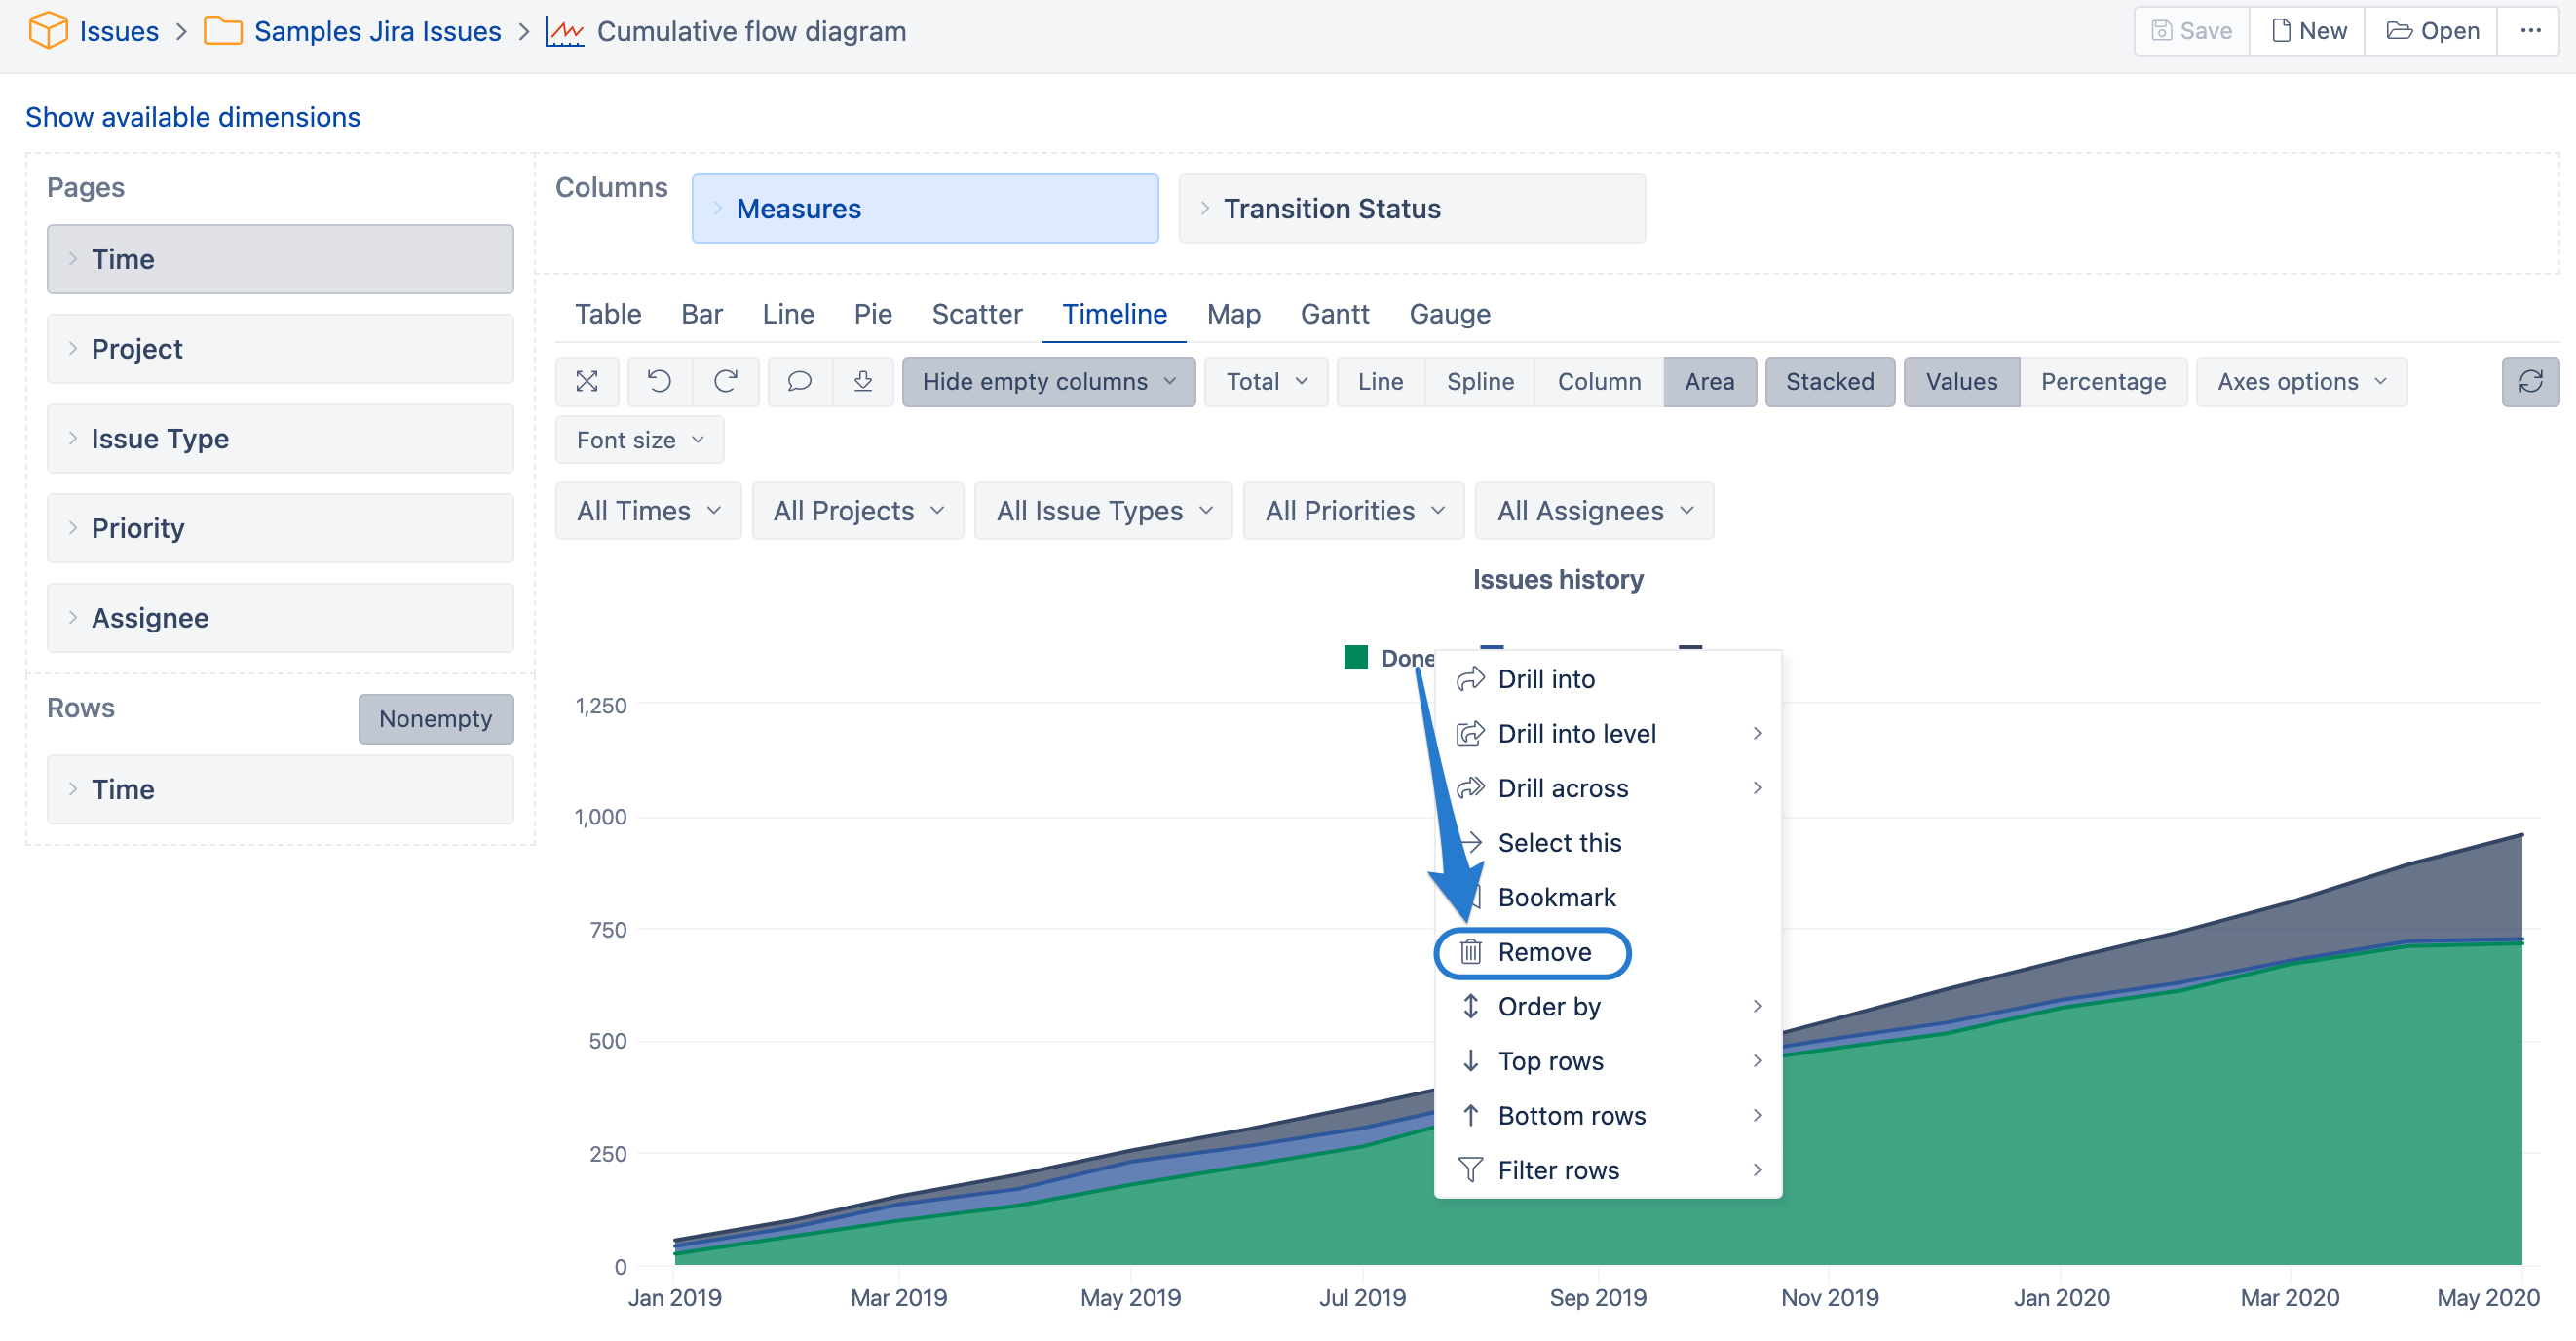
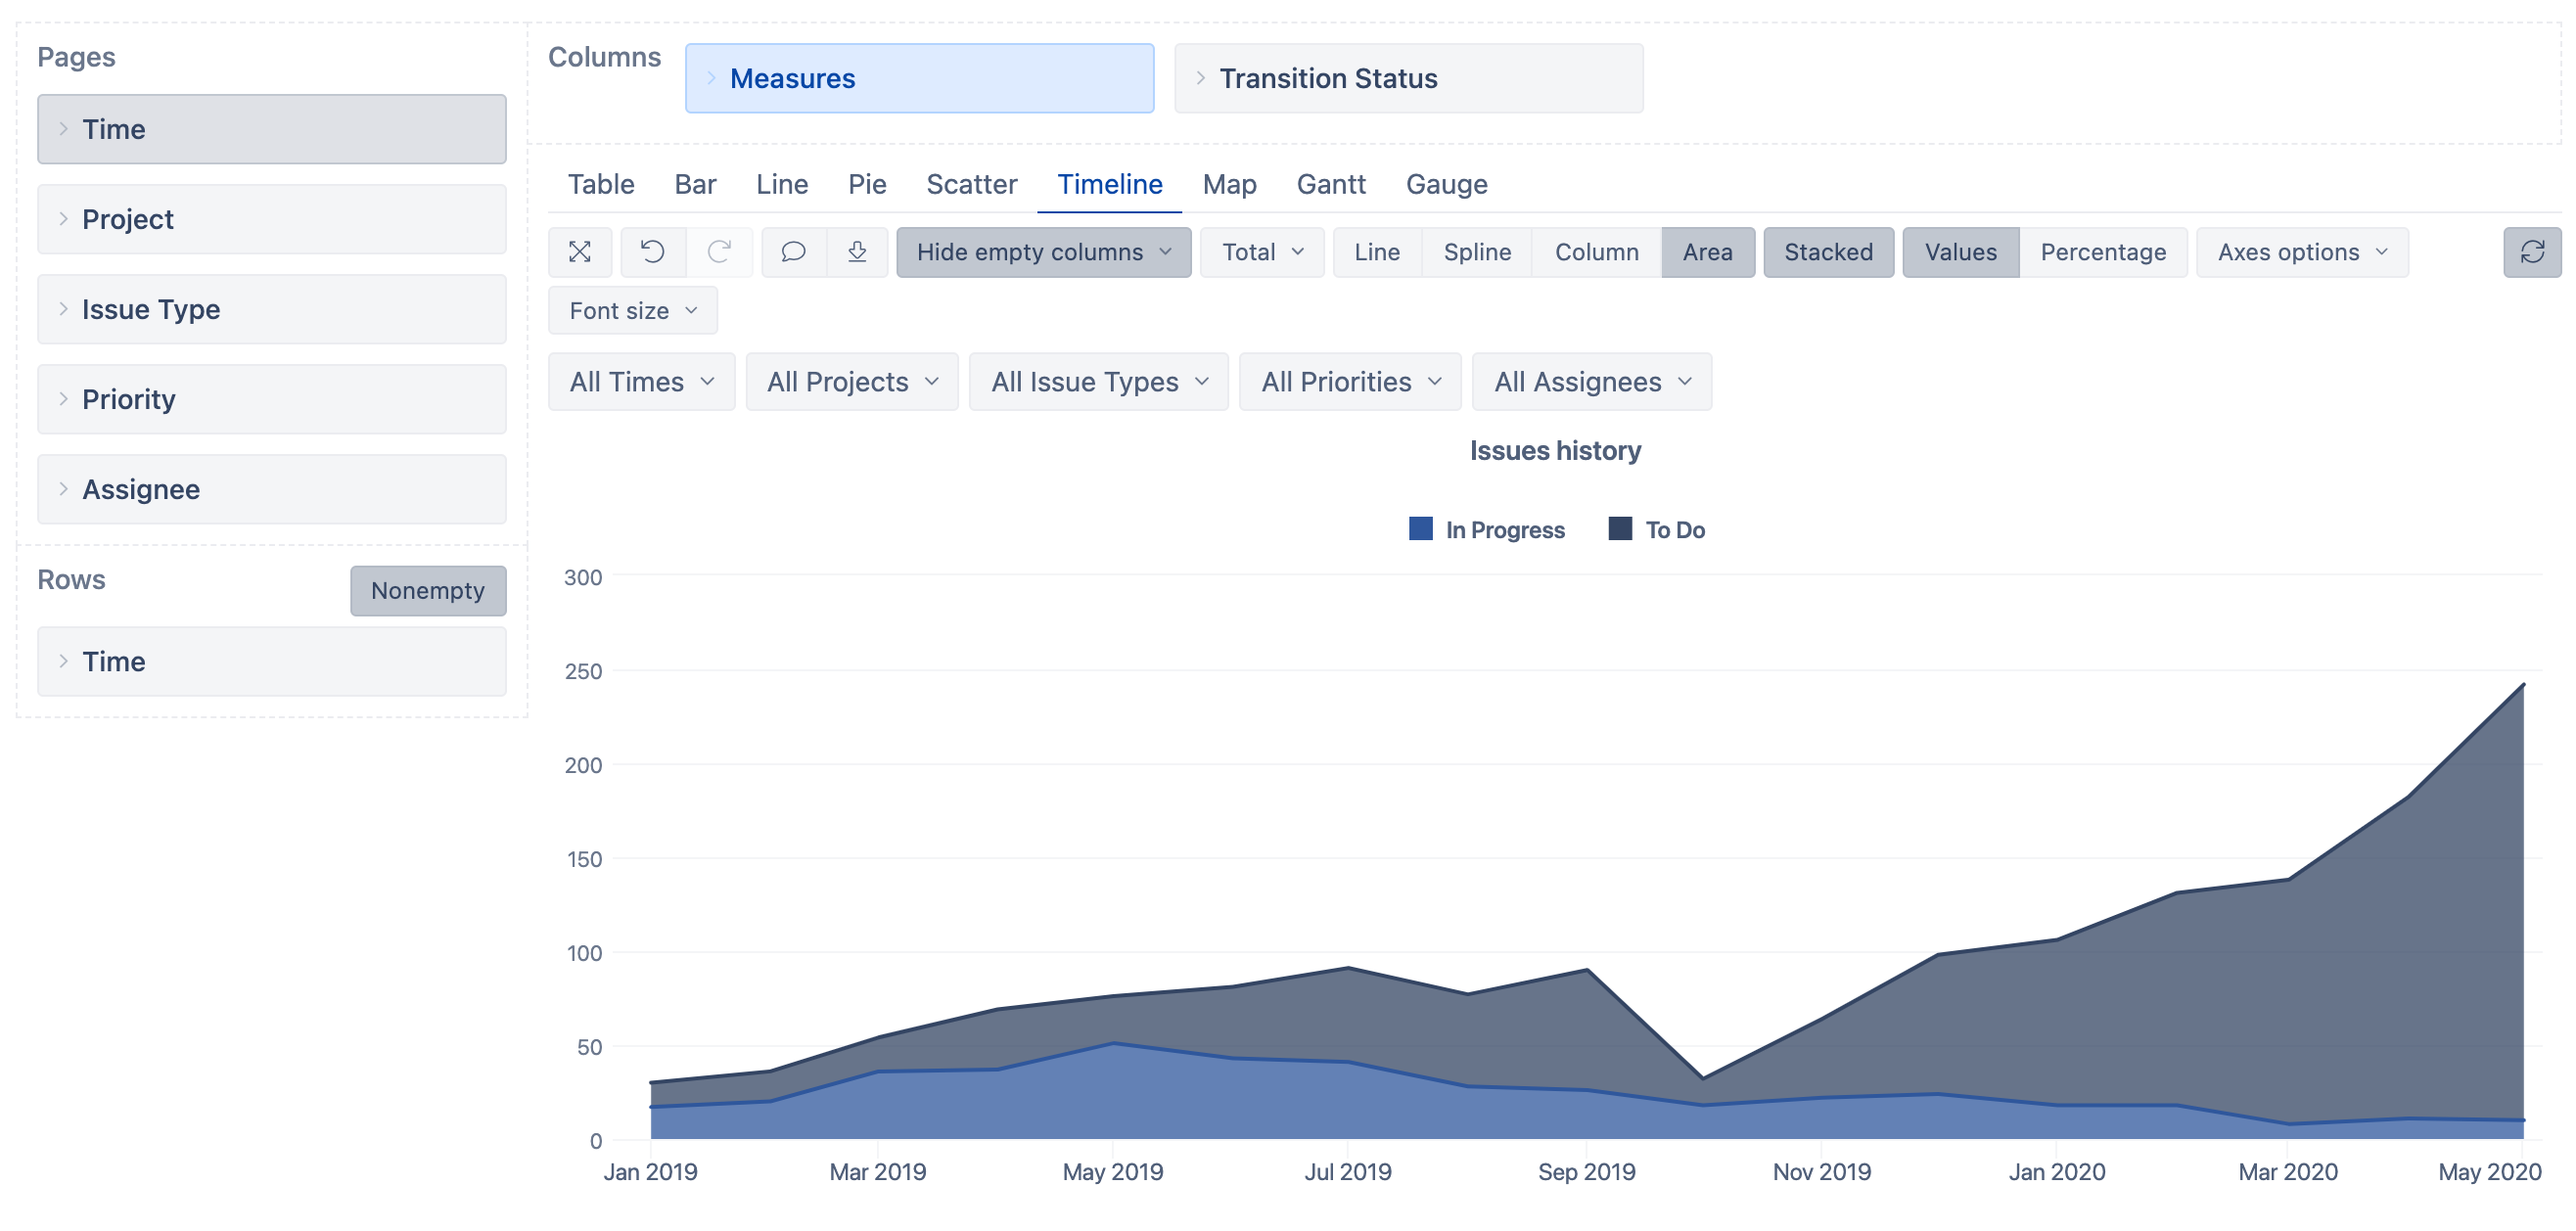
I would suggest that you remove the statuses (or categories) you are not interested in seeing in the cumulative flow diagram (save the report after removing the status):
Hello @lauma.cirule is there any solution regarding this issue? I have a similar problem, I would like to see completed issues within 8 weeks time frame, no older than it. How can I achieve it?
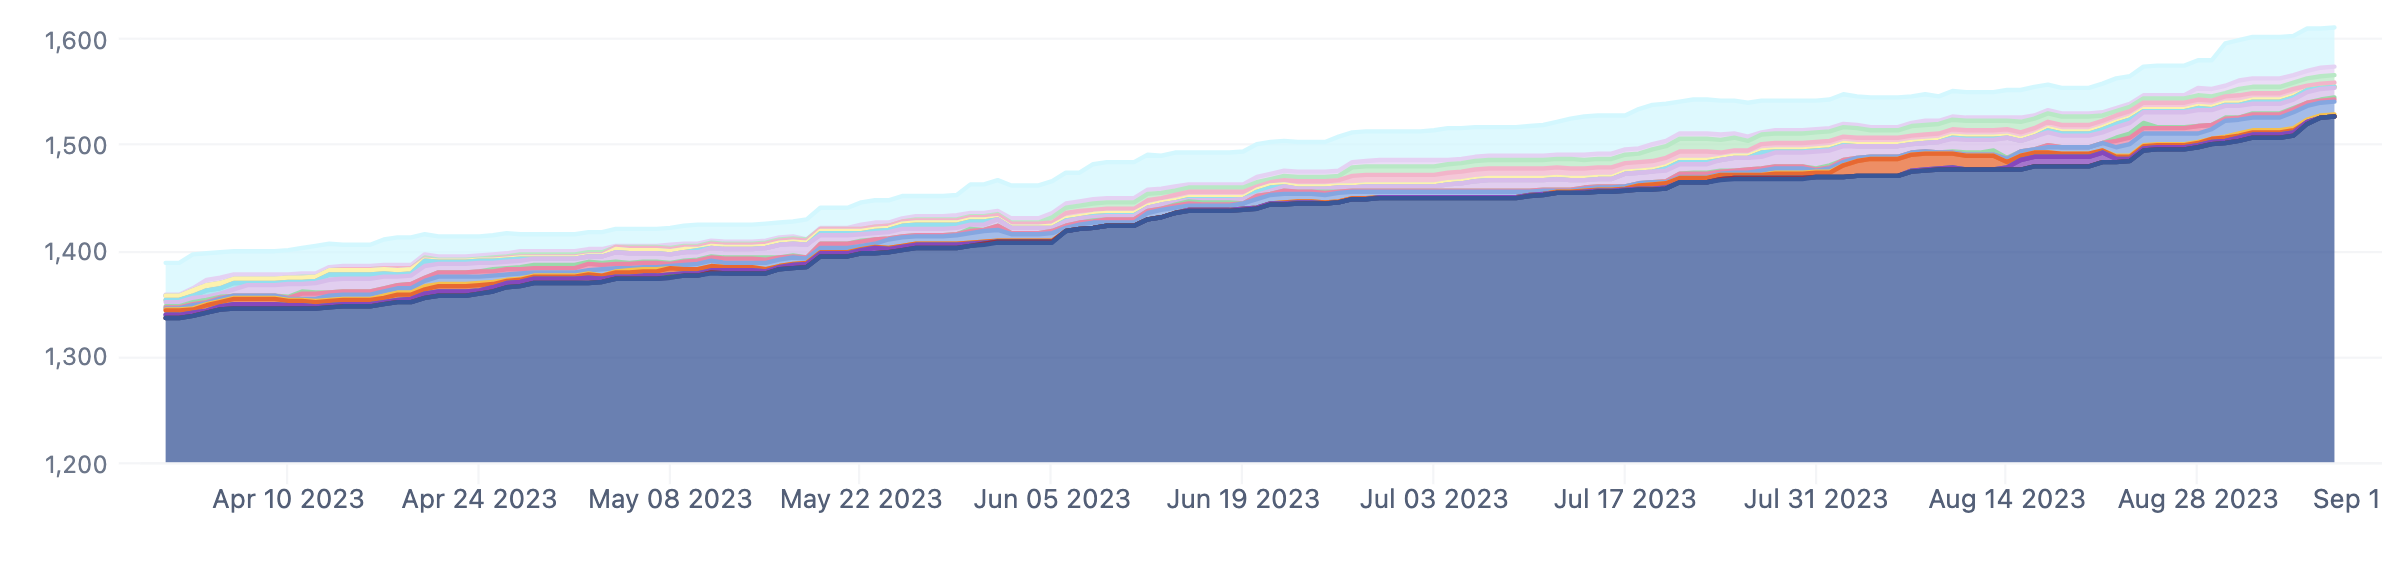
The necessary changes depend on what is your current report context. But please note that you can filter the report by using Time dimension both on rows and pages.
Here is an example calculated member for Time weekly hierarchy that would dynamically group the last eight weeks: