Hi @Tosin_Ojikutu,
The principle would remain the same as in related topics.
-
Import “Story Points” as a dimension. You can do this in Jira import options (Custom field import options)
Here is the Community post providing detailed instructions on how to do this:
Number of issues with "x" story points - #3 by ilze.leite -
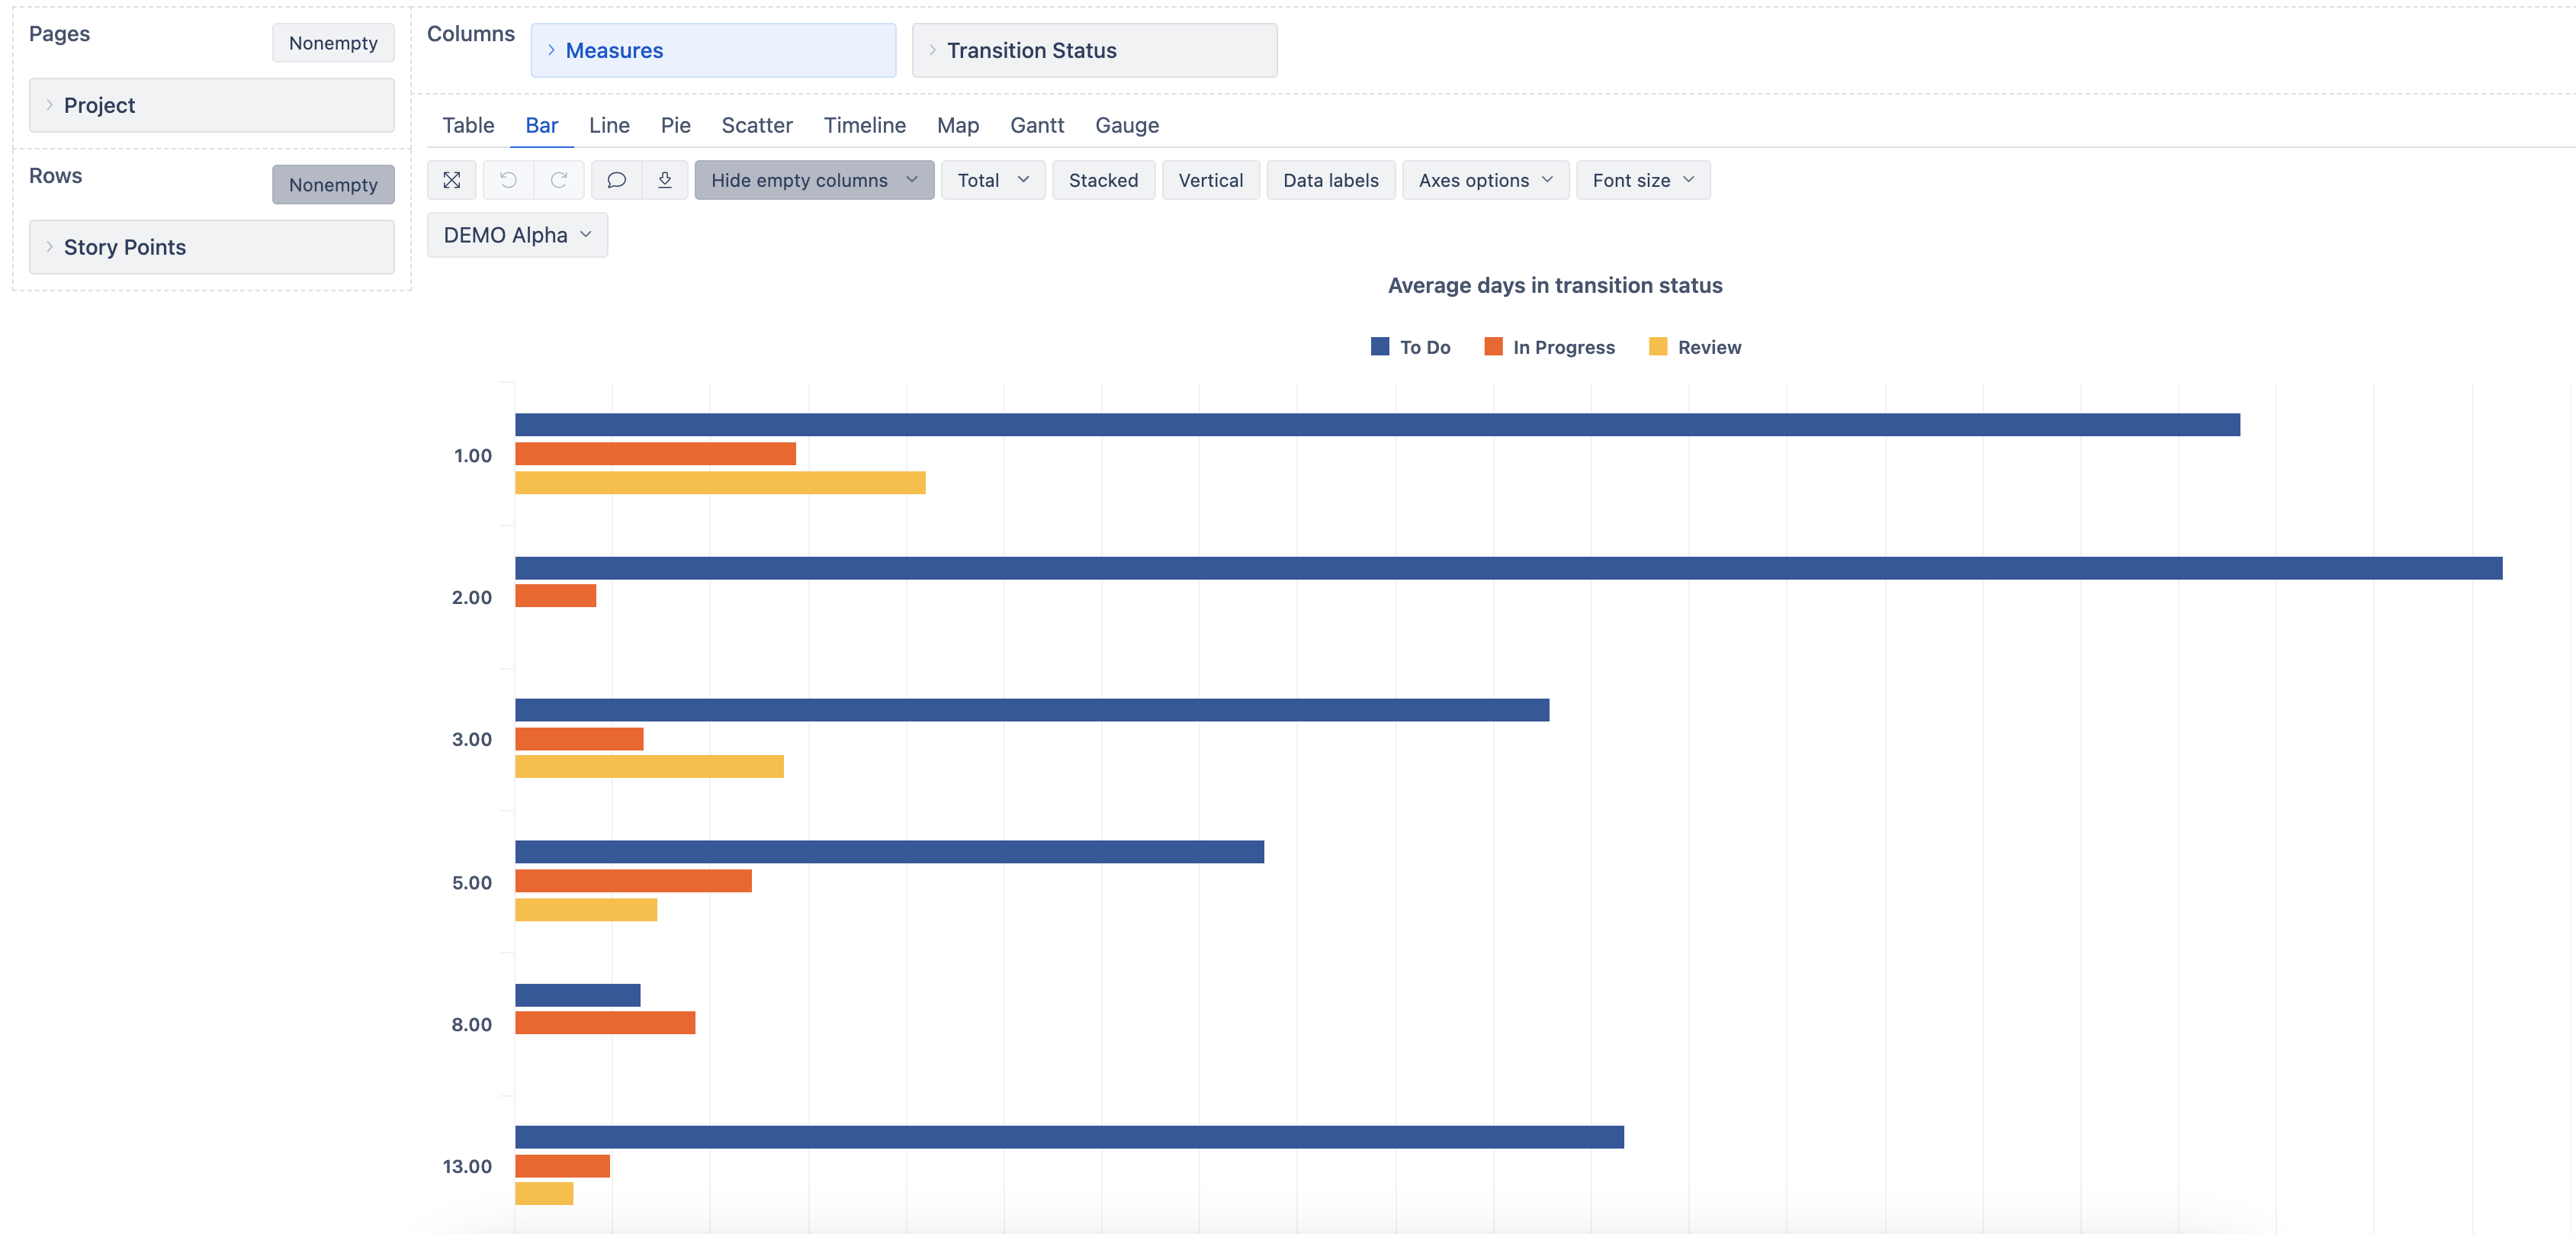
Import After data import, set the new dimension “Story Points” on report rows to group metrics by story point values.
-
On report columns, select measure "Average days in transition status" and dimension “Tranistion Status”.
-
Represent data in a Bar chart.
Best,