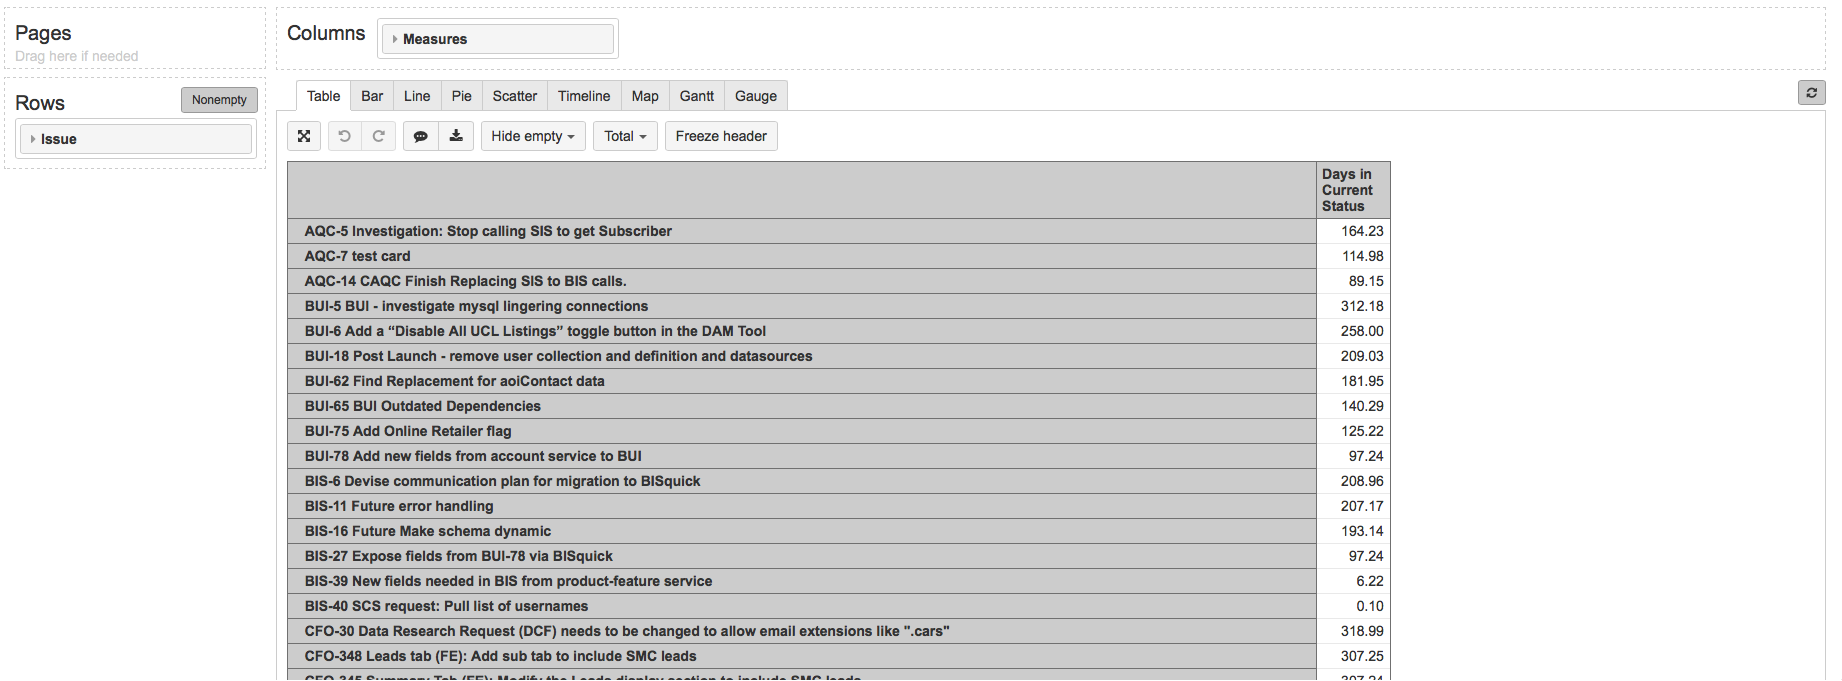
trying to generate a report that shows only the number of days in the current status but appears that using status give the a cumulative time an issue has been in a specific status not jus the current time. I am looking to capture something like the JIRA Time in Source Status from JIRA
I have code that appears to work to get the correct number of days an issue is in a given status but can not figure out how to take it from a table to a graph
it seems you may want to benefit from Age in current status interval dimension (instead of Age dimension). This would be a custom dimension.
To get such a dimension, the following steps would be needed:
1.Start with creating a new calculated custom field in eayzBI advanced settings by pasting there the code below:
The formula above calculates time in the last status and creates intervals for 15 days, 15-27 days, 28-41 days, 42-56 days, and more than 56 days.
After updating settings, you should import this field into eazyBI as a dimension. For that, open import settings for edit and select this custom field for import as a dimension. Then run data import. During that, a new dimension ‘Age in current status’ will be created.
In the report, you can use the default measure ‘Issues created’ and this new dimension ‘Age in current status’ in rows and ‘Status’ dimension in columns.
For more detailed assistance, please contact eazyBI support via email support@eazybi.com
Hi Ilze,
Is there a possibility to create a similar dimension, but not for days in status, but days since last updated? We are currently trying to catch issues that are just forgotten and counting them with filters is rather slow
Good to see you again!! I love this new code for creating these intervals in the current status dimension. I tried to add this code to my advanced settings and I got an error. There error I got was “invalid top level keys: database”.