Hello from Germany,
I have created a Measure that shows me the percentage of solved StoryPoints per Sprint. It’s an easy formula:
[Measures].[Sprint Story Points completed]
/
(
  [Measures].[Sprint Story Points completed]
  +
  [Measures].[Sprint Story Points not completed]
)
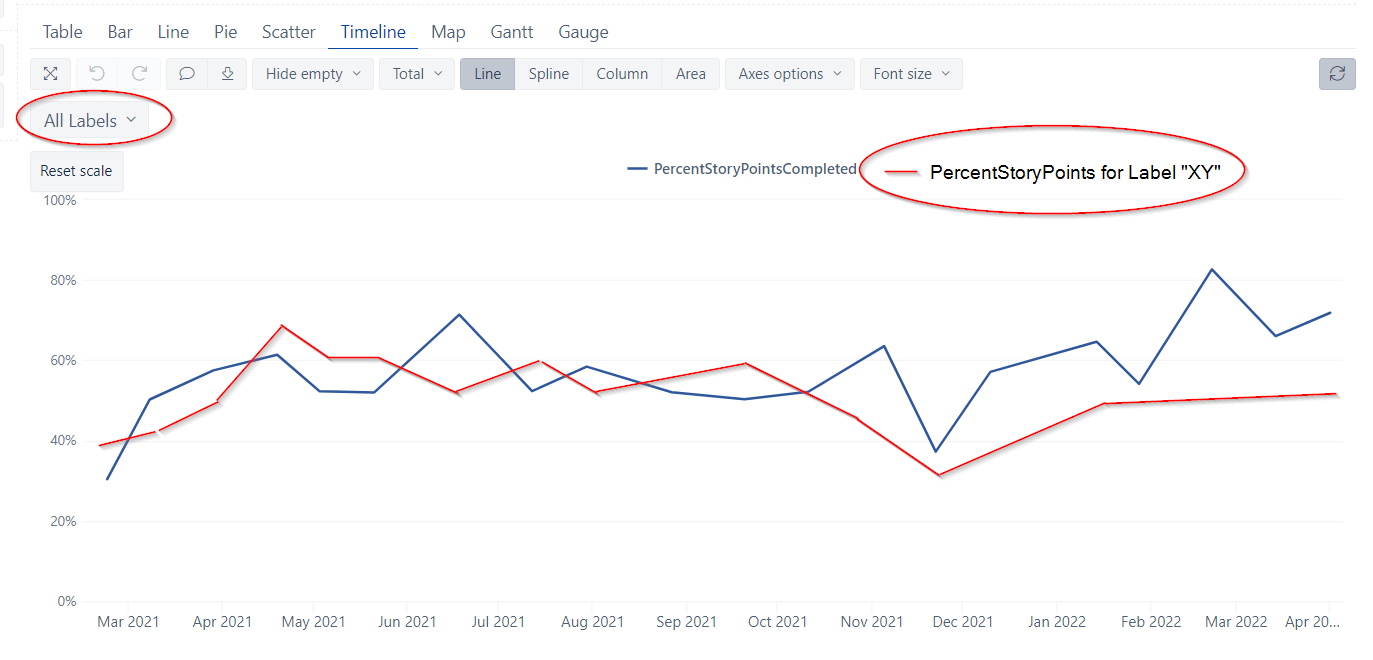
Since the different Teams in my project are maintained in labels I would like to show one diagramm with multiple curves based on the labels of the solved issues.
Of course I can pull “Labels” to Pages, but unfortunalty this shows only one curve. It would help me a lot if I could show multiple curves based on labels.
Is there a possibility to do this? See the red line (hand-painted) in the Screenshot for details:
Thank you in advance and have a good start into this week ![]()