Is there a way to show 3 dates in the gantt chart? For example, I have start date, requested go-live and target go-live.
I would like the gantt chart to show start date → target go-live but have a symbol in the gantt chart for the requested go-live.
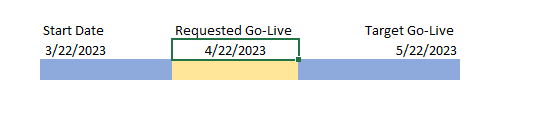
Example:
Start Date: 3/22/2023
Requested Go-Live: 4/22/2023 (show as a symbol on gantt chart to show a milestone)
Target Go-Live: 5/22/2020
Hi @tfioresi
In the Gantt chart, you can only display 2 dates.
There is, however, another option to show several date ranges by using the bar chart as an alternative. You could have two dates marked as range type and other dates as scatter type.
Here are a few demo reports where a Bar chart is used as Gantt:
Issue Epic Gantt Chart (Bar as Gantt) - Issues - Jira Demo - eazyBI
Blocker Story Plan (Bar as Gantt) - Issues - Jira Demo - eazyBI
Issue status changes (Blocker Stories, Bar as Gantt) - Issues - Jira Demo - eazyBI
And here is a very good community post about how you can customise the Bar Chart: Configuration of gantt chart in EazybI
Best wishes,
Elita from support@eazybi.com