Hello,
I am new to easyBI and trying to create a Gantt chart in EasyBI by uploading a flat file that includes the following fields.
Project
Resource Name
Project Role
Primary Role
Allocation
Project Start Date
Project End Date
Role Start Date
Role End Date
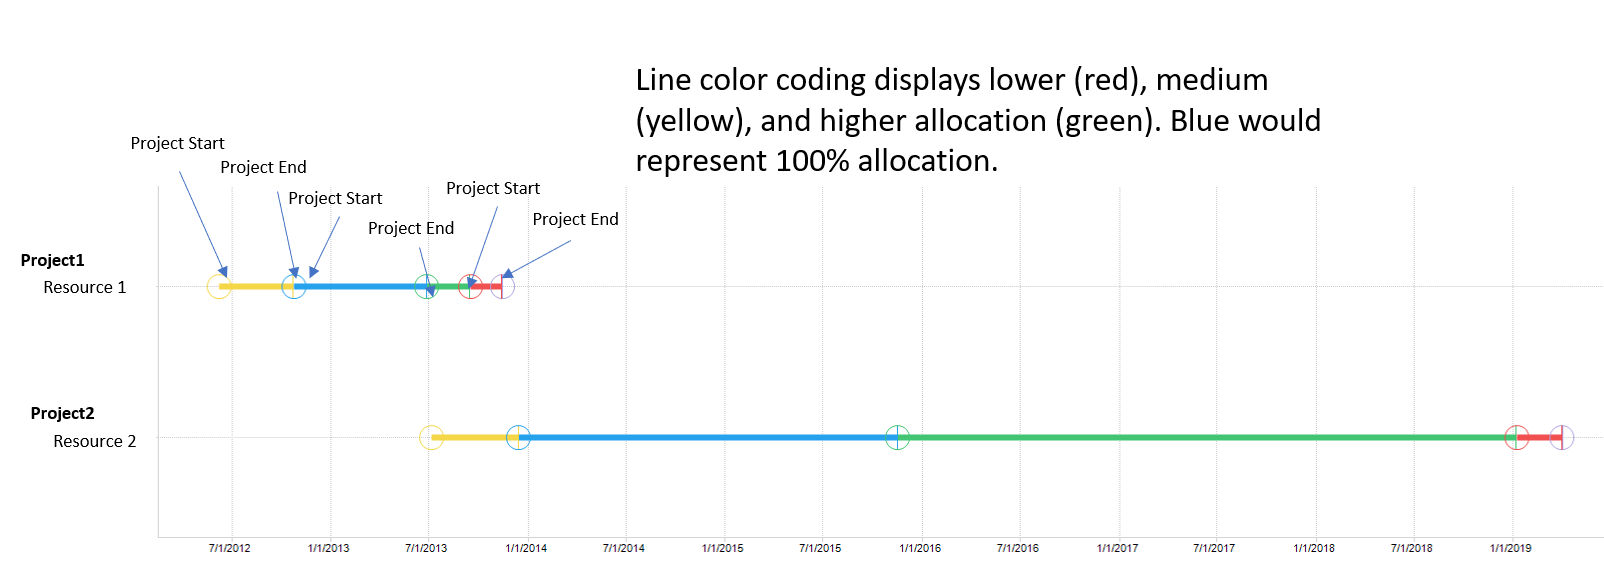
How do I import these fields to enable a chart like this to be created?
The attached image is where I would like to get. Thanks in advance for any help.
Kind regards,
Matt