Dear community,
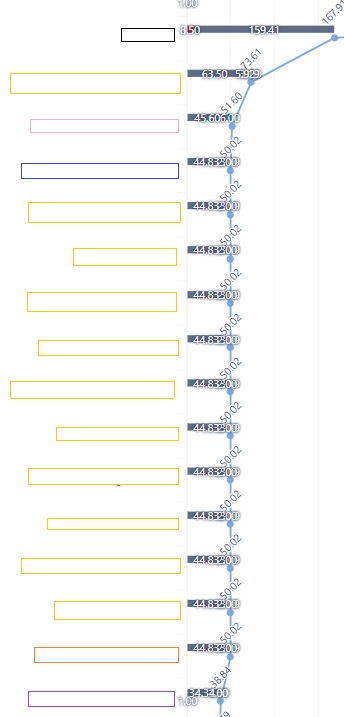
in the attached picture you see see a bar chart from our reporting.
All of the boxes are different objects, but the yellow ones are related to the same topic. Is there any possibility to sum them up in the bar chart?
Best regards-
Nicole
Hi @Nicole.Brueckner
Thanks for posting your question!
I suggest considering importing the Assets in the Assets cube. Here are instructions - Assets. Based on your message, it seems that “Same topic” may be an attribute of the Asset and you could import it under the object type attributes section and then either use it as dimension or create a hierarchy under the Objects dimension (you can visually see how it’s done in the Community post here - Assets: How to Import "Inbound References" in eazyBI)
Let me know if this works!
Best wishes,
Elita from support@eazybi.com