Good afternoon I need help editing my measure code. I need to group tasks by field test1, values test1.1 and test 1.2.
Here is an example of my code:
Aggregate({
([Issue].CurrentHierarchyMember),[test1].[test1.1],
([Issue].CurrentHierarchyMember),[test1].[test1.2]
})
I managed to group the values, but when expanded, it still displays all the tasks in the project.
And I don’t understand why this is happening.
Additional values in columns
I add a new measure to the computational measure Issue
Hi @jon33367
When aggregating a new member in a dimension, you can reference only the members from the same dimension. In this case, when referencing also the test1 dimension, it can produce unexpected results.
Instead of defining a new member in the Issues dimension, you can use the test1 dimension in the Rows section to divide the issues by the members of test1 dimension.
Please see the following example on how you can divide issues by the members of another dimension:
Then, if you want to group together the test1.1 and test1.2 members, you can create a new calculated member in the test1 dimension with the following formula:
Aggregate({
    [test1].[test1.1],
    [test1].[test1.2]
})
Let me know if this fits your use case or if you have any additional questions on this!
Nauris
Thanks for the answer. But unfortunately I need to group the issue field together with the test1 field
That is, it will not work at all to aggregate 2 fields?
It’s just that I have just such a task to create a report, to aggregate issue with test1.
If not in the first case, please let me know.
If We put the test1 field first, and the aggregation has already been created in it, by 2 values in the fields.
How can the issue be displayed, exactly for this aggregation by the exact number. Screenshot example below:
so that when the first element is opened, the issue on the created aggregation is immediately pulled up
Hi @jon33367
Could you please explain what exactly you would like to achieve?
Would you like to show a list of issues with the test1 attribute, or is there some different selection that you would like to display?
Let me know what exactly would you like to build and I’ll try to guide you in the right direction.
Best regards,
Nauris
You need to create a report by directions
Retail and development: filters 20Kt Development and 54.2Kt Racks
Port infrastructure and granaries: filter 57.8Kt Port infrastructure
Support structures: filter 10Kt Solar energy
Transactions concluded for 2023, t: the sum of the values of the cells “Planned shipment volume of GP in the current year, t:”. Includes epics with business process status From “New Kick-off Deal” to “GP Guarantee Period”
As well as separate fields in measure measures:
Fact of shipment 2023, t: the sum of the values of the cells “Actually shipped volume of GP, t:”. Includes epics with business process status From “New Kick-off Deal” to “GP Guarantee Period”
Visible transactions, tons (potential demand): the sum of the values of the cells “Planned volume of shipment of GP in the current year, tons:”. Includes epics with business process status From “Potential Deal” to “Decision on Participation”
Epics with the “Deal Refusal” attribute are not included in the table at all.
Each direction can be opened for separate transactions through “+”
That’s what I need.
Create a report in which it will be possible to view grouped Directions by field, when expanded through +, tasks of this grouping by field were opened
Hi @jon33367
First, if all of the fields you’ve mentioned are issue custom fields in your Jira, you would need to import them as Dimensions, Properties or Measures accordingly.
For example, the “Directions” custom field should be imported as a Dimension.
If you would like to retrieve all the children issues of Epics that are in your mentioned business process status, you should first import the “Business process status” field as a dimension and then, also import it as an inherited field dimension: JavaScript calculated custom fields
This will allow you to filter the child issues of the Epic by their parent Epic business process status.
Next, you should also import all of the numeric values as measures in the account: Custom field import options
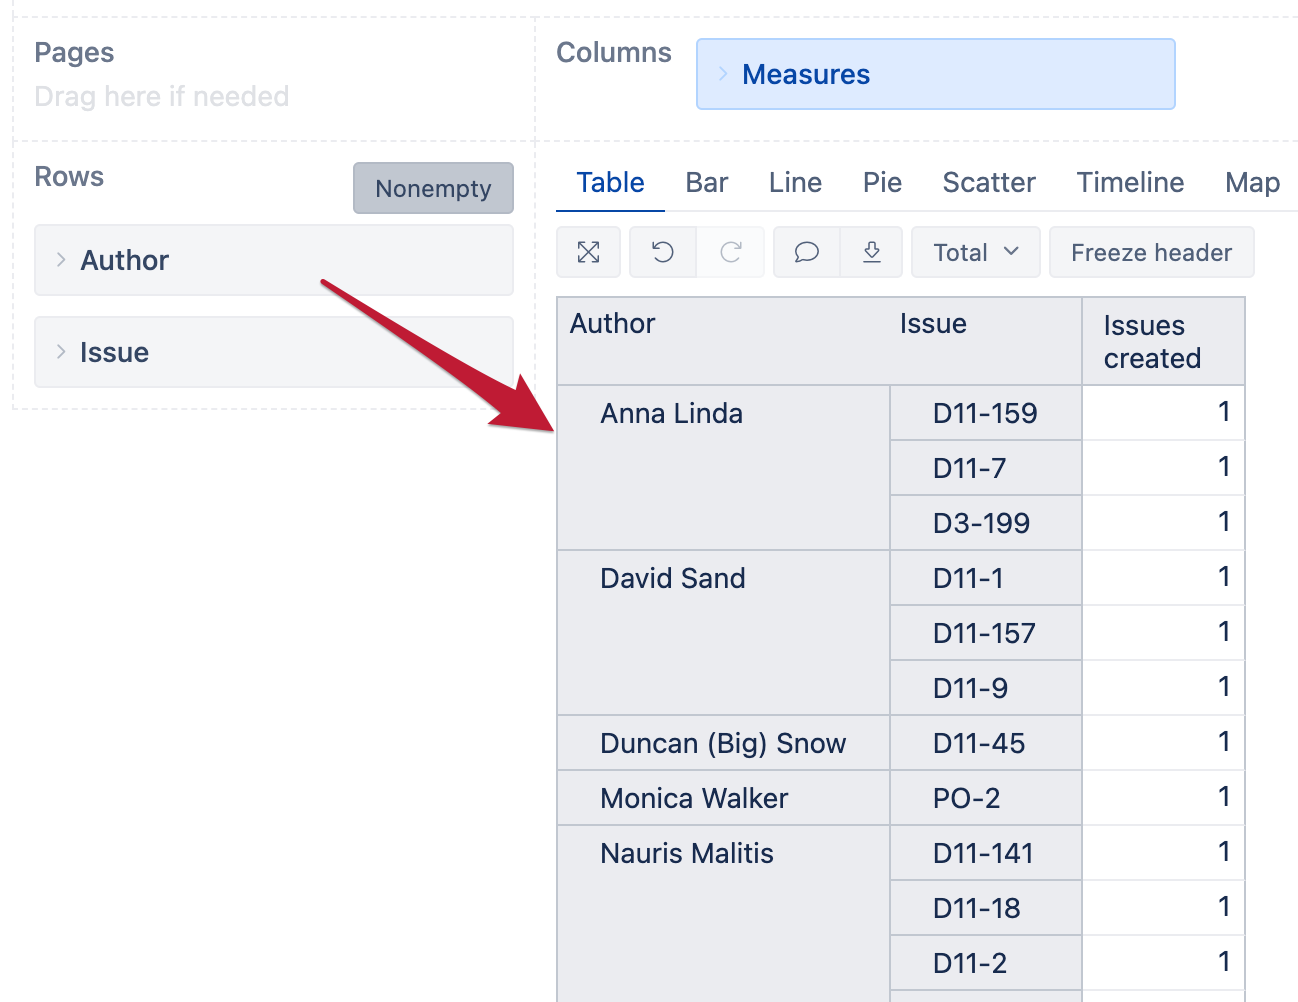
When all of this is imported, you can select the Directions dimension for Rows and enable the “Pages” option for this dimension to be able to filter the report by specific Directions. Next, add the Issue dimension to Rows and select the “Epic” level from the “Epic” hierarchy in the “All hierarchy level members” section.
You should also include the Business process status dimension in the Pages section, so you can filter the Epics by their current status or, you can use the Inherited dimension to filter the Epics and also their child issues by the current Epic status. You can see an example of this here: Filter issues in sprint when epic has a certain value - #3 by gerda.grantina
When all the selections and filters are set up, you can enable the measures you want to see across your selected directions and Epic business process statuses.
Let me know if I can further assist you with this!
Best regards,
Nauris
Hi @nauris.malitis
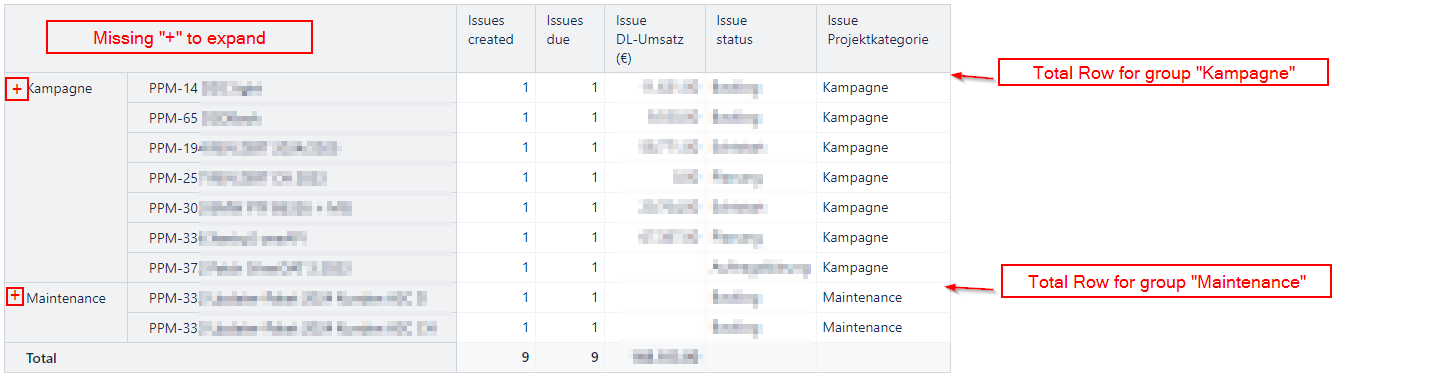
I have the same issue to create this report. But we have other fields ![]()
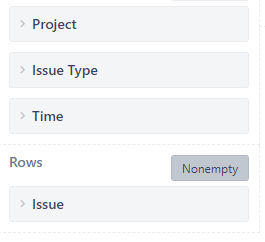
I have to group the issues by customfield in rows. With your description I got the report but the “+” Button is missing where I can see the total for every group. How can I achieve this?
Best Regards,
Thomas
Hi @thomas
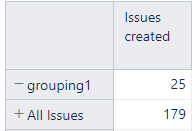
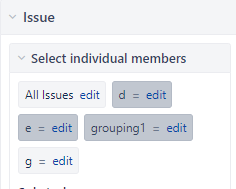
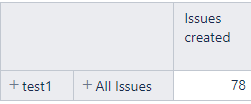
In the Rows section, for the Issues dimension, select the default “All Issues” member. This will show you the Total values for All Issues associated with this group. You can then click the “+” for All Issues to see the individual issues.
Let me know if this works as expected!
Best regards,
Nauris