Hello,
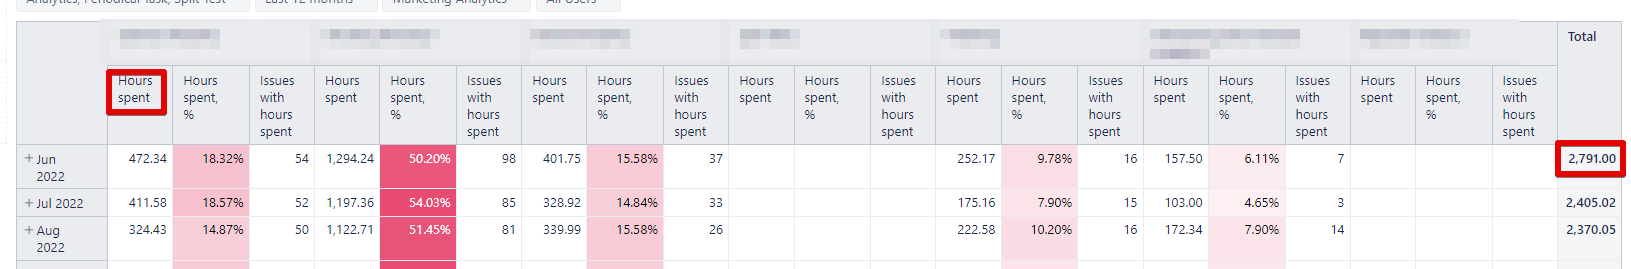
I need to calculate Total value only for the Hours spent measure, but when I use default function for this, it calculates all the measures in a row.
How I can do this?
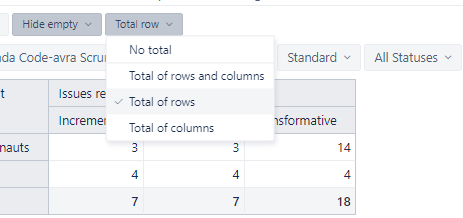
You want to total rows and not columns.
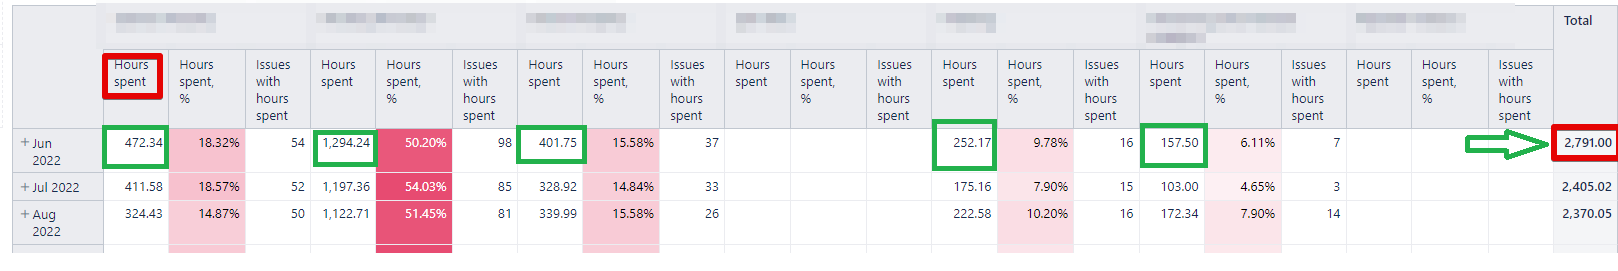
@MagnumBI No, I need to sum the values ONLY in the green squares:
I understand. I appreciate what you’re trying to achieve.
I would make those columns into a separate report and total them. Then you can add that to a dashboard that also contains a report on the percentages.
However, if you have to have all of these columns in one report, but you only want to add up the “Hours Spent” ones, your best option is to create a custom measure that totals all of them together. Then you just add that custom measure to the end.
However, if you have to have all of these columns in one report, but you only want to add up the “Hours Spent” ones, your best option is to create a custom measure that totals all of them together. Then you just add that custom measure to the end.
Yes, I need to have all of these columns in one report, but summarize only the “Hours Spent” columns. If I add a custom measure - it will show up in all of the above dimension columns. I only want the “Hours Spent” total in the “Total” column, like here: How to Customize Total Row Count Values
@eazyBI-Staff Could you please help me?
I assume that the first dimension in columns is “Logged by”. In that case you can create the following calculated member “Total” in the “Logged by” dimension with a following formula
CASE WHEN [Measures].CurrentMember.Name = 'Hours spent' THEN
  Sum(
    Filter(
      Generate(VisibleColumnsSet(), [Logged by].CurrentMember),
      [Logged by].CurrentMember.Name <> 'Total'
    ),
    [Measures].[Hours spent]
  )
END
which will filter all assignees used in the report without this Total member and then will calculate a sum of Hours spent.
Then in columns select “All Users”, drill into it, and then add this Total member. In addition, hide all empty rows and columns.
Here is a link to a test report that I created Total of hours - Issues - Jira test - eazyBI
Please let us know if this workaround will solve your need.
@raimonds.simanovskis Hi, you are almost there. The first dimension in the columns in my report is a custom dimension, that I wrote in Javascript. But your solution was perfect for my problem.
Thank you very much!