This post des desrbes how you can import numeric fields as dimensions or interval dimensions to see how issues are grouped by individually assigned values.
And since eazyBI verion 6.6 and on Cloud, this solution is more approchable, eazyBi account Owner, user admin or Data admin can create those dimension form the Jira Import options without disturbing Jira administrator.
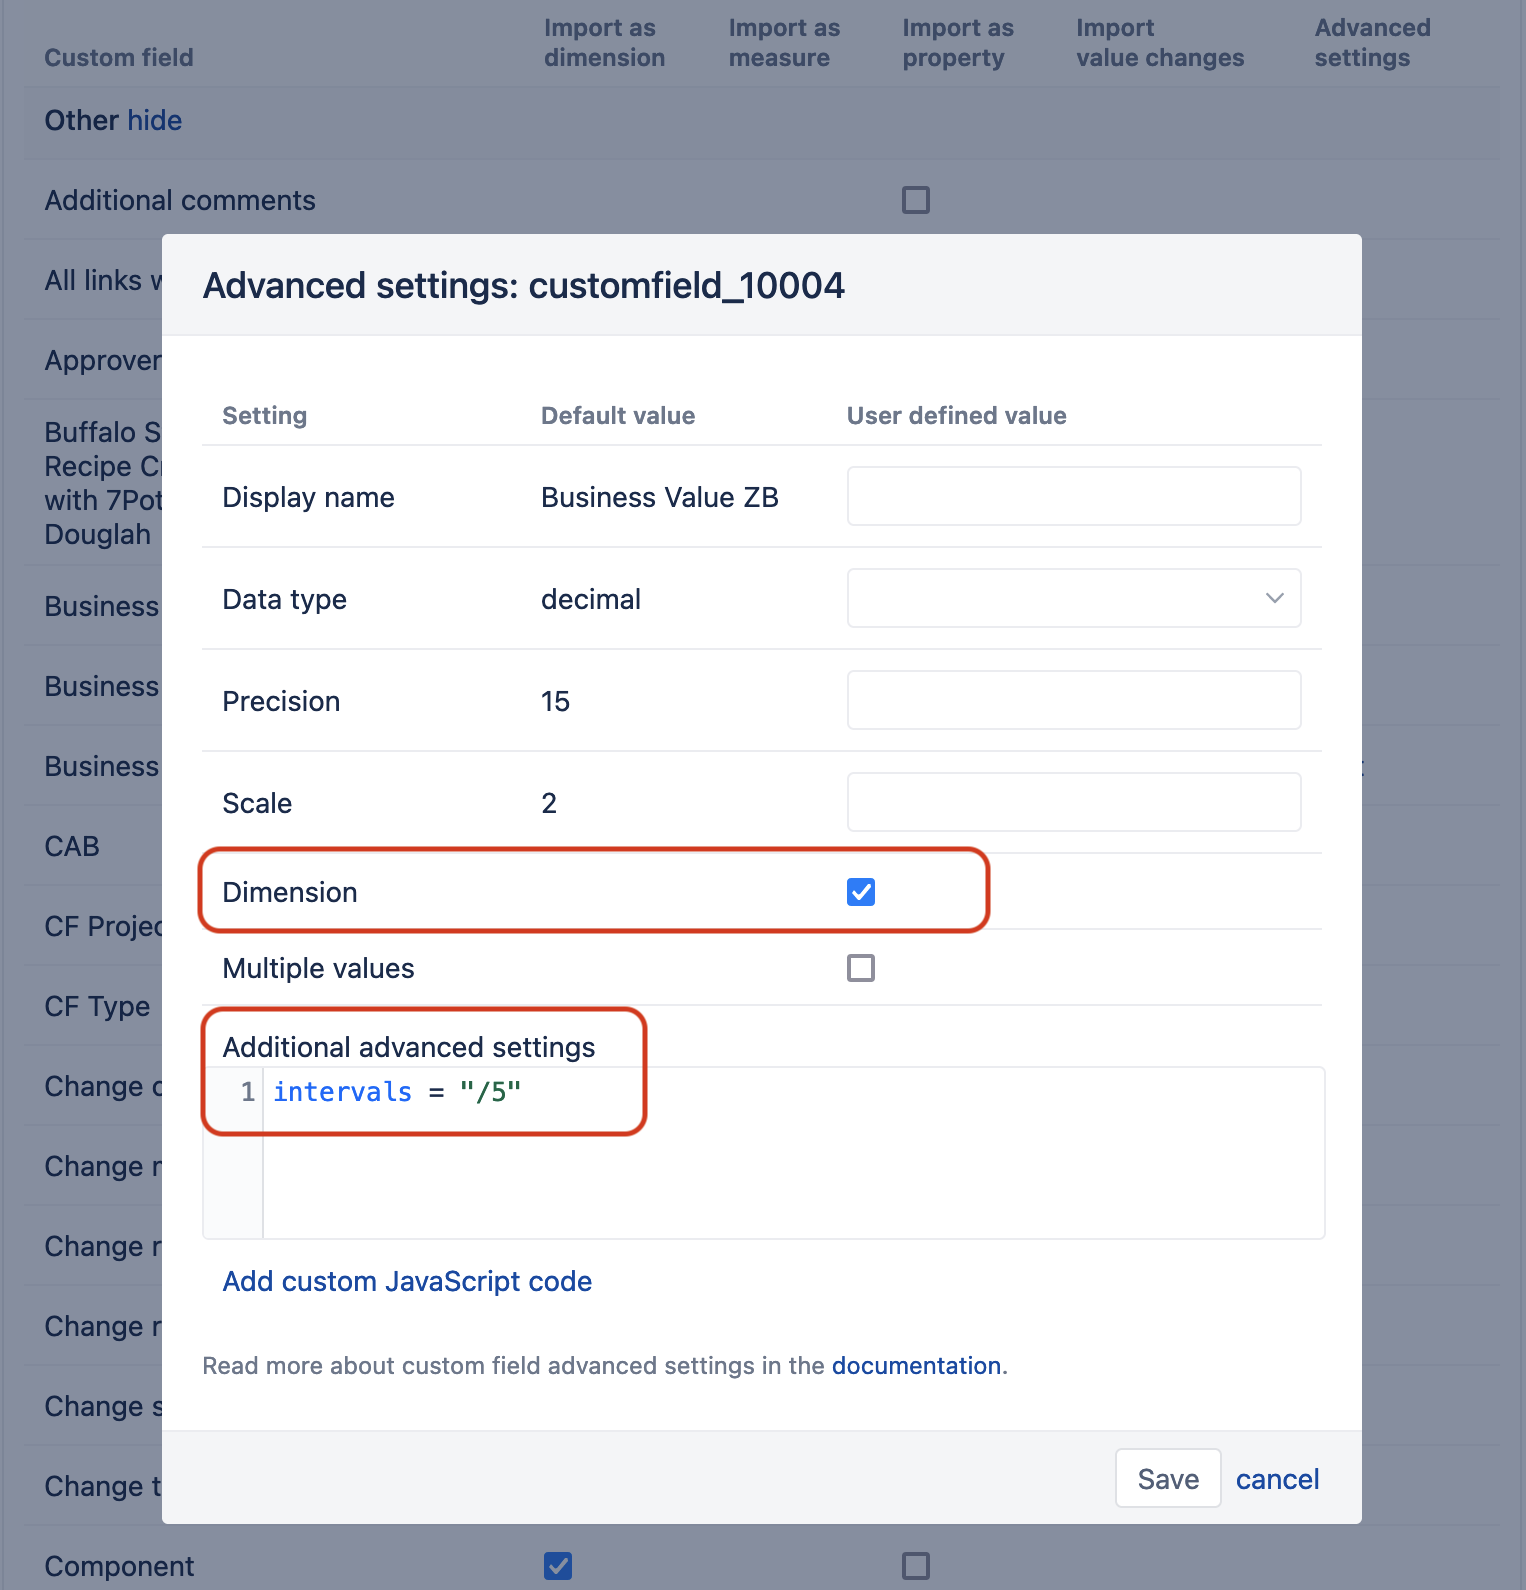
Find the numeric cutom field in import options and Edit its advanced setting (see the documentation
Custom field import options).
- mark to import it as “Dimension”
- In additional advanced settings, paste parameter to group values by intervalas:
intervals = "/5"
See also the example with Story Points in this Community post:
Best,
Zane / Support@eazyBI.com