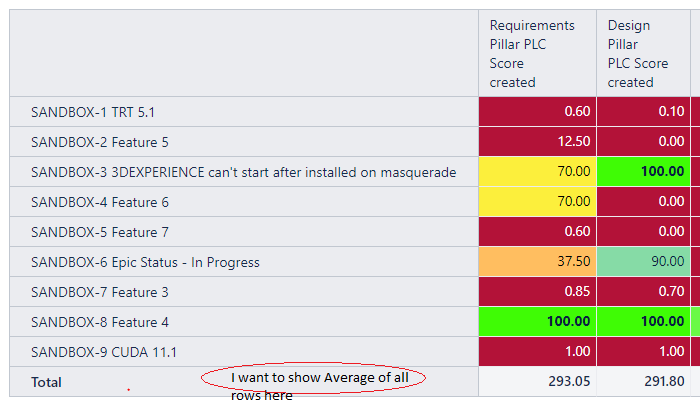
I have a table with each record as a JIRA issue, and my columns have some x score. I want to show average of all records at the bottom. i could see easyBI can show total of all records, but couldn’t figer-out to show the average of columns.
@Manoj_Gupta
A quick way to do this is to left click on the column header for your score measure. Select “Add calculated -> Statistical -> Average”. I’m not sure if it’s possible to display the number at the bottom.
Hi @Manoj_Gupta
The total row would always return the sum.
You can’t force it to calculate average result.
If you need to see average values, perhaps you could create a new calculated measure with the AVG function in it:
NonZero(
Avg(
Filter(
Descendants([Issue].CurrentHierarchyMember,[Issue].[Issue]),
[Measures].[Design Pillar PLC Score created]>0
)
,
[Measures].[Design Pillar PLC Score created]
))
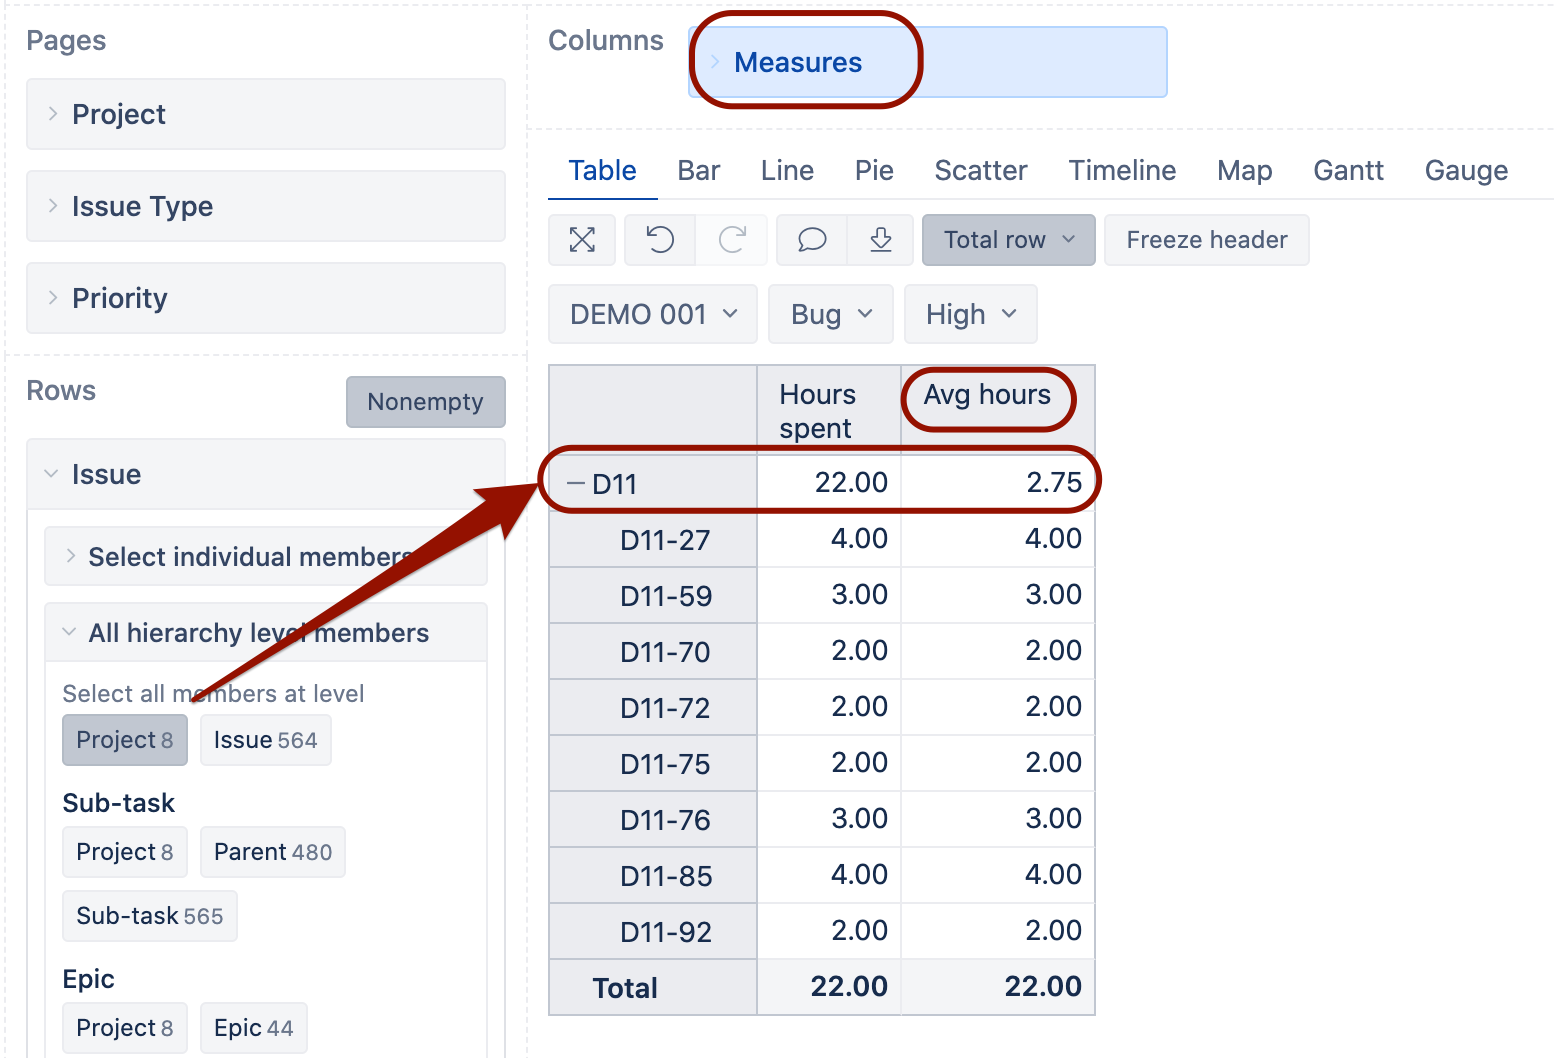
When using such calculated measures please enable “Nonempty” cross join for your report rows to optimize the calculation steps for this measure:
https://docs.eazybi.com/eazybijira/analyze-and-visualize/create-reports#Createreports-Pagedimensions
Then you could select the “project” level to see average results in your report
But it would still not show average result on “Total” row (just on project level)
See also the attached image.
Martins / eazyBI support
Hi @martins.vanags,
I was wondering if you could assist with a similar issue. I would like to have a new column with the average number of estimate story points across all sprints for each assignee. Please see link below for original post. Thank you!