I’m looking for a solution here please kindly help double check
I need to know average days from transition status A to transition status B
If possible I would like also to be able to deduct few transition status between A and B to get a more accurate number regarding the average days I need
This is because in our project, we have status OPEN = created, Submitted = send to engineering, and then Pending Build = a fix has been validated and ready for next release; so we would need measure average days from “Submitted” to “Pending Build” within engineering.
Another thing is that, between “Submitted” and “Pending Build”, users can set issue to “Clarify” status where we would be waiting for other team to respond our queries e.g. a demo fix is waiting for customer validation. Ideally, we would like to be able to exclude the days spent here too as these are not the engineering days.
Please try finding the answer in the following community post:
In other words, you could create a new calculated member in “Transition Status” dimension and then use this filter for the measure “Average days in transition status”
Thanks for details. What I needed might be something different and I’m running out of clue… could you please kindly have a look?
Say issues go through transition status (1) Open > (2) Analyze > (3) Clarify > (2) Analyze > (4) Coded > (5) Verify > (6) Closed
What I needed would be like
a. The days in transition status (2) and (3) per each issue
b. The days in transition status (2) only, per each issue
c. The issue total number in status (4), (5), (6) per each e.g. “reporter”
Could you provide an example of these calculation? I seem unable to find any guide how to come up with the definition…
In this case, I would first create new calculated member in “Transition Status” dimension (which will be used for requirement a) and one also in “Status” dimension (which will be used for requirement c). Both code examples below.
For “Transition Status” dimension:
For a and b requirement, then I would use the measure “Days in transition status” in columns and “Issue” dimension (at issue level) in rows. And finally drag “Transition Status” dimension to pages, where I would enable the new calculated member
In a similar way, I can filter the same report for requirement b
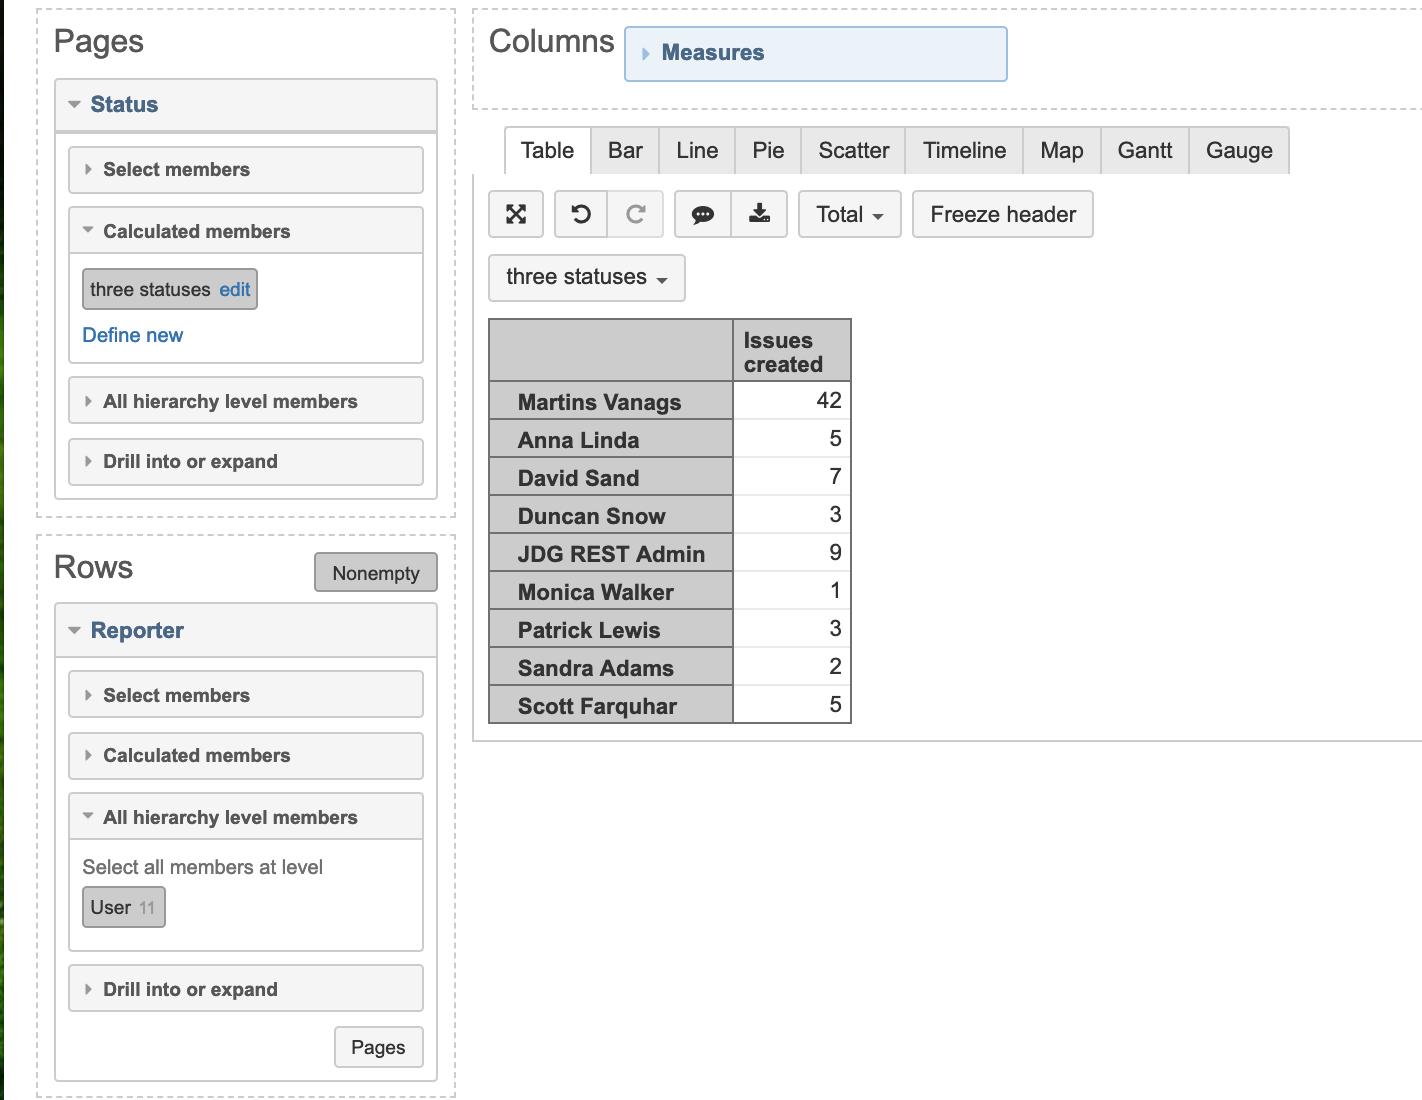
For the last requirement, I would use “Issues created” in columns, “Reporter” dimension (at the user level) in rows and then select new “Status” dimension calculated member in rows.
See both described reports attached as images below.
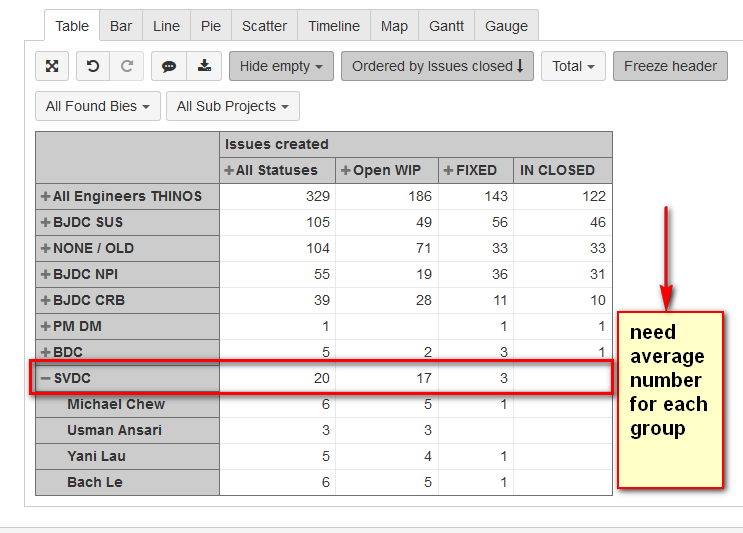
One more question - how can I calculate the average number of (3)?
Now I added users in groups in Row, and have all numbers in Column; next I need to have the average number for each group… not sure how to do the calculation in this scenarios?
I’m guessing something like… [issue numbers] / [number of members in user group]
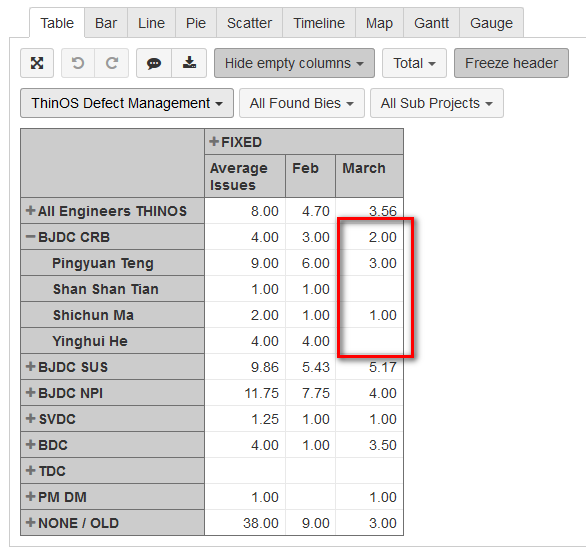
Now I got the average number per group. One last thing I would need, is to calculate the issue numbers per time e.g. on monthly basis, how many issues were fixed by each of the group and group average…
For e.g. there are totally 14 FIXED in BJDC CRB group, average 3.5 FIXED per user in group (4 users); these are the data from Feb to March; I want calculate how many FIXED in Feb and how many FIXED in March… would this be doable?
Hi,
In this case, you could create two new calculated measures (one for each month) using the new “Average issues” measure as a base for the calculation.
(1) There are 4 engineers in group “BJDC CRB”, and in March, 2 of them have 0 fixes. However, when calculating average for group in March, it now does (3+1)/2 = 2 … while we need it (3+0+1+0)/4 = 1 — how can we include the zero count members?
(2) And… the time measure is based on “issue created date”… I was looking for the time measure be based on “issue transition to status” e.g. issues transitioned to “Pending Build” status in March… how shall we do the calculation in this time measure?
Please try this code, which should return the set of all group engineers (regardless of how many issues were created in particular month) and then calculate the average of transitions in a give month to status Pending Build:
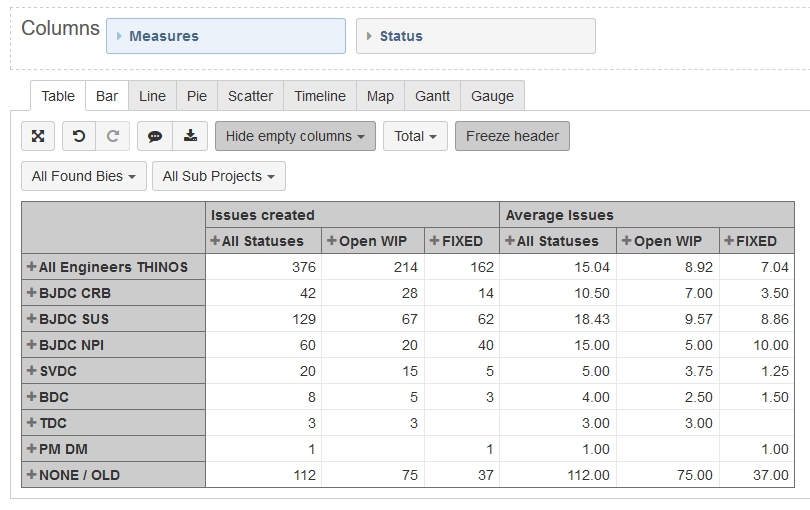
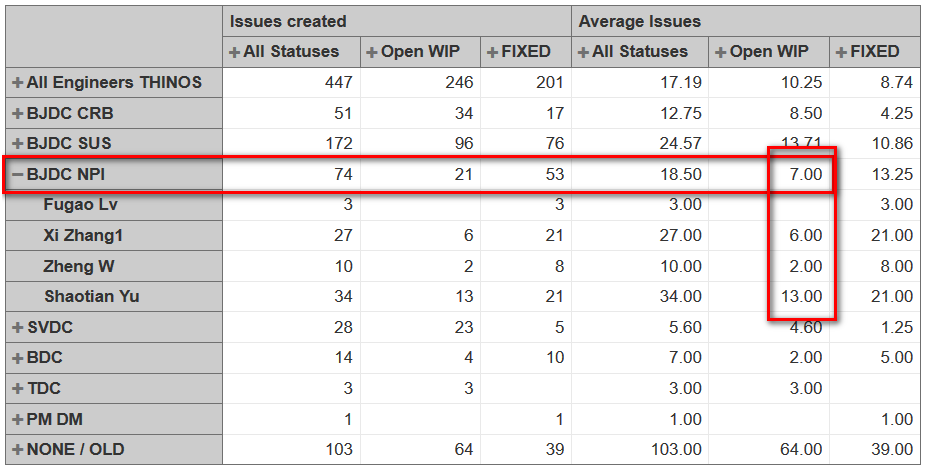
One thing first – in earlier calculation, to calculate average issue count for each group, I used below calculation and get the results – with the problem that, in group “BJDC NPI”, there are 4 engineers, totally 21 “Open WIP” issues – the average is now showing = 7 which = 21/3, as one of the engineer shows “0” in this data.
We need results showing = 5.25 which = 21/4, so to count all engineers including the ones with 0 data. Please kindly help… Thanks!
Did you import a new dimension “Engineeer” in your cube? as earlier you were using “Reporter” dimension for your calculations
If that is the same “Reporter” dimension try this code instead:
The above calculation would divide total issues for each status with the total number of users in the group if they have created at least 1 issue in any of statuses.
That should include all users from the “Reporter” dimension group as otherwise they would not exist in that dimension (if they haven’t created any issues) at all.
Basically we need to average issue on users first. I tried the code, and it showed me same results as before. In a group, if a user has 0 issue, he is not in the average count.
For info, the “engineer” does not create issues; we have leaders to add value in the “engineer” data field in the issues (in certain status); it is a custom data field we added in the system. The “engineer” is not same as “assignee” at all time.
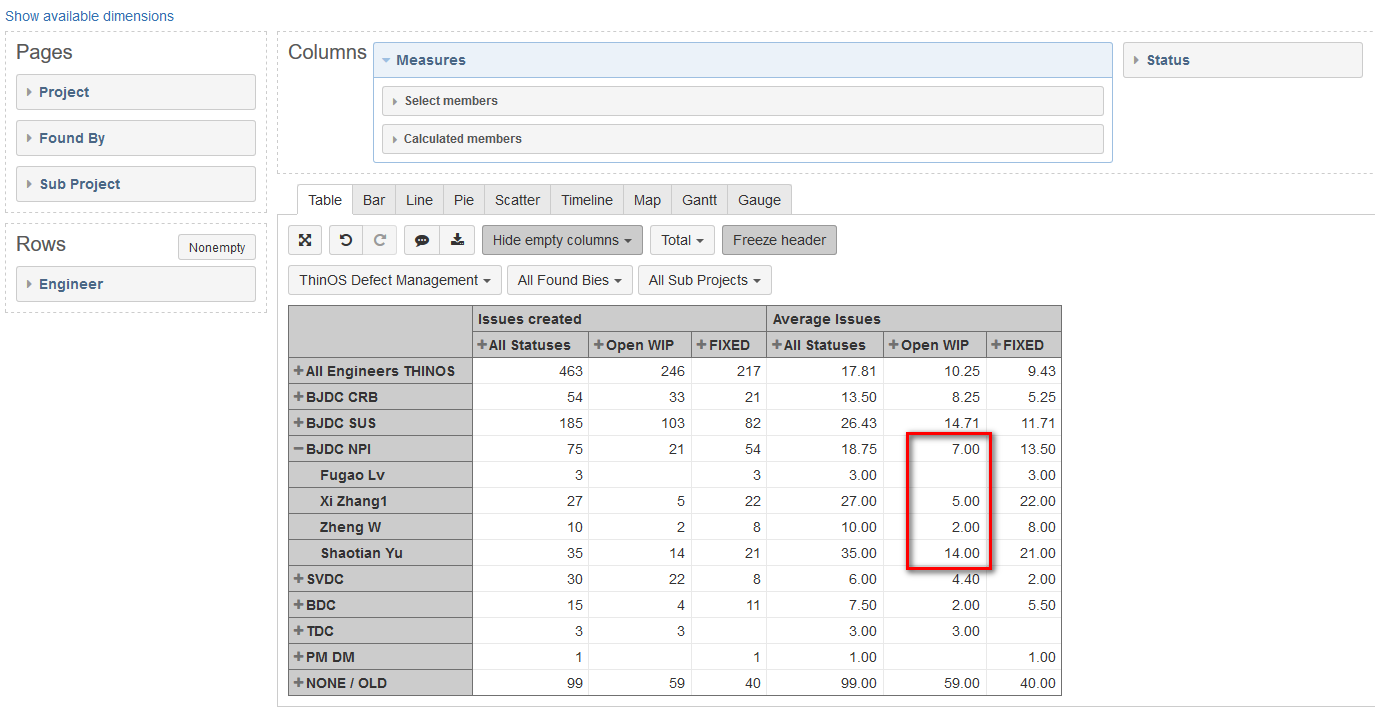
Here’re full details in my report
I used Measure and Status in Colum
I used Engineer in Rows
I created calculation in Status to aggregate values between “WIP" and “fixed”
I created calculation in Engineer, to aggregate values between engineer groups
Lastly, I created “average issues” with below calculation – as you can see from the screen shot, this does not calculate correctly; when in a group some engineer has 0 issue added with them – the average on the group is not correct.
Meanwhile the other data are correct. Please kindly help advise. Thanks!
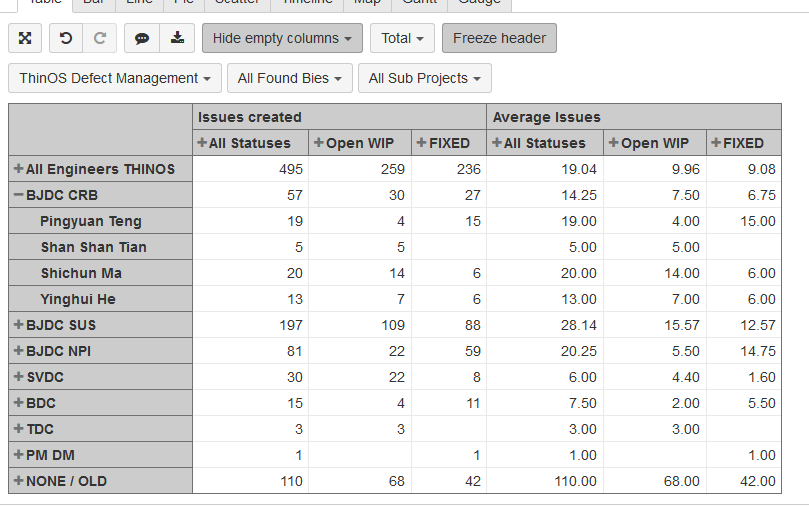
Last one - how to calculate the number of engineers in each engineer group, at each row, and display the number at the column, along with the “issue created” “average issues” as shown in screen shot below?
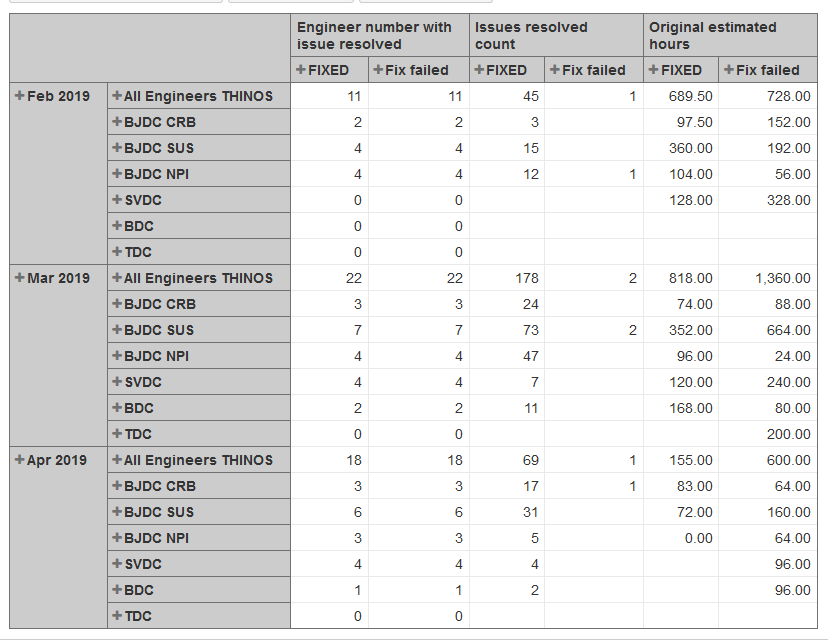
I used this in a new report – to calculate issue resolved per engineer.
… Row = engineer
… Column = Measure + Status
……. Measure #1 = engineer number with issue resolved
….… Measure #2 = issue resolved count
……. Status #1 = issue resolved in fixed status
……. Status #2 = issue resolved but is now reopened (fix failed)
Check the “engineer number with issue resolved” – it shows same number between “fixed” and “fix failed” — is it possible to show the engineer number per Status e.g. if the engineer has no data in “fixed”, or no data in “fix failed”, then to show no data in the “Engineer number” > “Fixed” or “Engineer number” > “Fix failed”
Hi all - without reading through all of the posts here (since the requirements are quite specific), is there a simple way to just find out the average days to transition from the first status (e.g. Open in this example) until the last status (e.g. Closed in this example)?