Do we have any ways to show original committed, added after and removed from the sprint issue count in dashboard single table ?
I can show as three different pie chart or table…but was trying to see if I can manage it in one single table ?
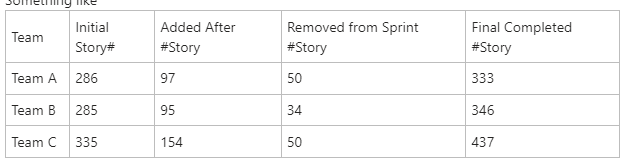
Something like
Hi, @ysharma
To see all the measures in one table/chart, create a report with all desired measures in it. Select them in the Measures. Please consider using our Sprint scope measures: Sprint issues committed, Sprint issues added, Sprint issues removed, Sprint issues completed.
Please see the similar report as guidance: Sprint issue balance - Issues - Jira Demo - eazyBI
You can choose the pie chart option instead of a bar.
Kind regards,
Ilze M eazybi@support.com