Building off a previous post
I have a custom numeric field for a set of Jira issues within a project. Some days the value will change for one or many issues, other days it does not change for any issues.
Plotting the change of the sum of the custom field values over time can be done with via the importation of the fields history as a measure and I have this working. However, no data will show on the days when no changes are made but the plot of the sum of these values on these no-change days is still of value.
So I want to show a daily sum of these numeric fields for a set of issues, regardless of whether they have changed day-day. I can see the custom field property values per issue and can create a cumulative sum, but there is no clear way to capture the total daily sum and plot only this value. How do I do this?
Caveat - I cannot show the Time dimension solely as days as there are too many days (5000+) and this either crashes eazyBI or times out and never shows up. I can show the Last 180 days or Last 90 days. Thanks.
Hi @Adam_hollow
If I understood correctly, you would like to see the “history” measure but only for the time period selected in your report and not all previous periods, right?
There is a report in our Demo account where the “Issues history” measure is adjusted for the “Done” status in the “Cumulative flow” measure: Cumulative flow diagram for selected period - Issues - Jira Demo - eazyBI
You can define a new calculated measure in the Measures dimension with a formula based on the “Cumulative flow” measure in the Demo account :
CASE WHEN
  DateCompare(
    Now(),
    [Time].CurrentHierarchyMember.StartDate
  ) > 0
THEN
CoalesceEmpty([Measures].[Risk Points history] -
([Measures].[Risk Points history] ,
 [Time].CurrentHierarchy.Levels("Day").DateMember(
  [Measures].[First date in report]
  )
),0)
END
Be sure to also define a new calculated measure “First date in report” with the following formula:
ConstantValue(
  VisibleRowsSet().Item(0).item(0).StartDate
)
Let me know if this fits your use case!
Best regards,
Nauris / eazyBI support
Thanks for the reply but that’s not what I’m looking for.
Another way to view it is to compute the daily cumulative sum of the two custom numeric fields, regardless of whether they have changed. So there will be days where the sums haven’t changed, which is what we want to show. As it stands now, the charts only update if one field in one issue gets updated, otherwise the chart does not update.
You can easily do this in Excel or G-Sheets by exporting the set of Jira issues of interest with the two numeric fields and then summing the two values for the issues exported. You’d then just plot those two summed values over time, regardless of whether or not they changed. But you’d have to do that everyday which of course is something that should be automated.
Hi @Adam_hollow
Completely missed your reply, sorry about that!
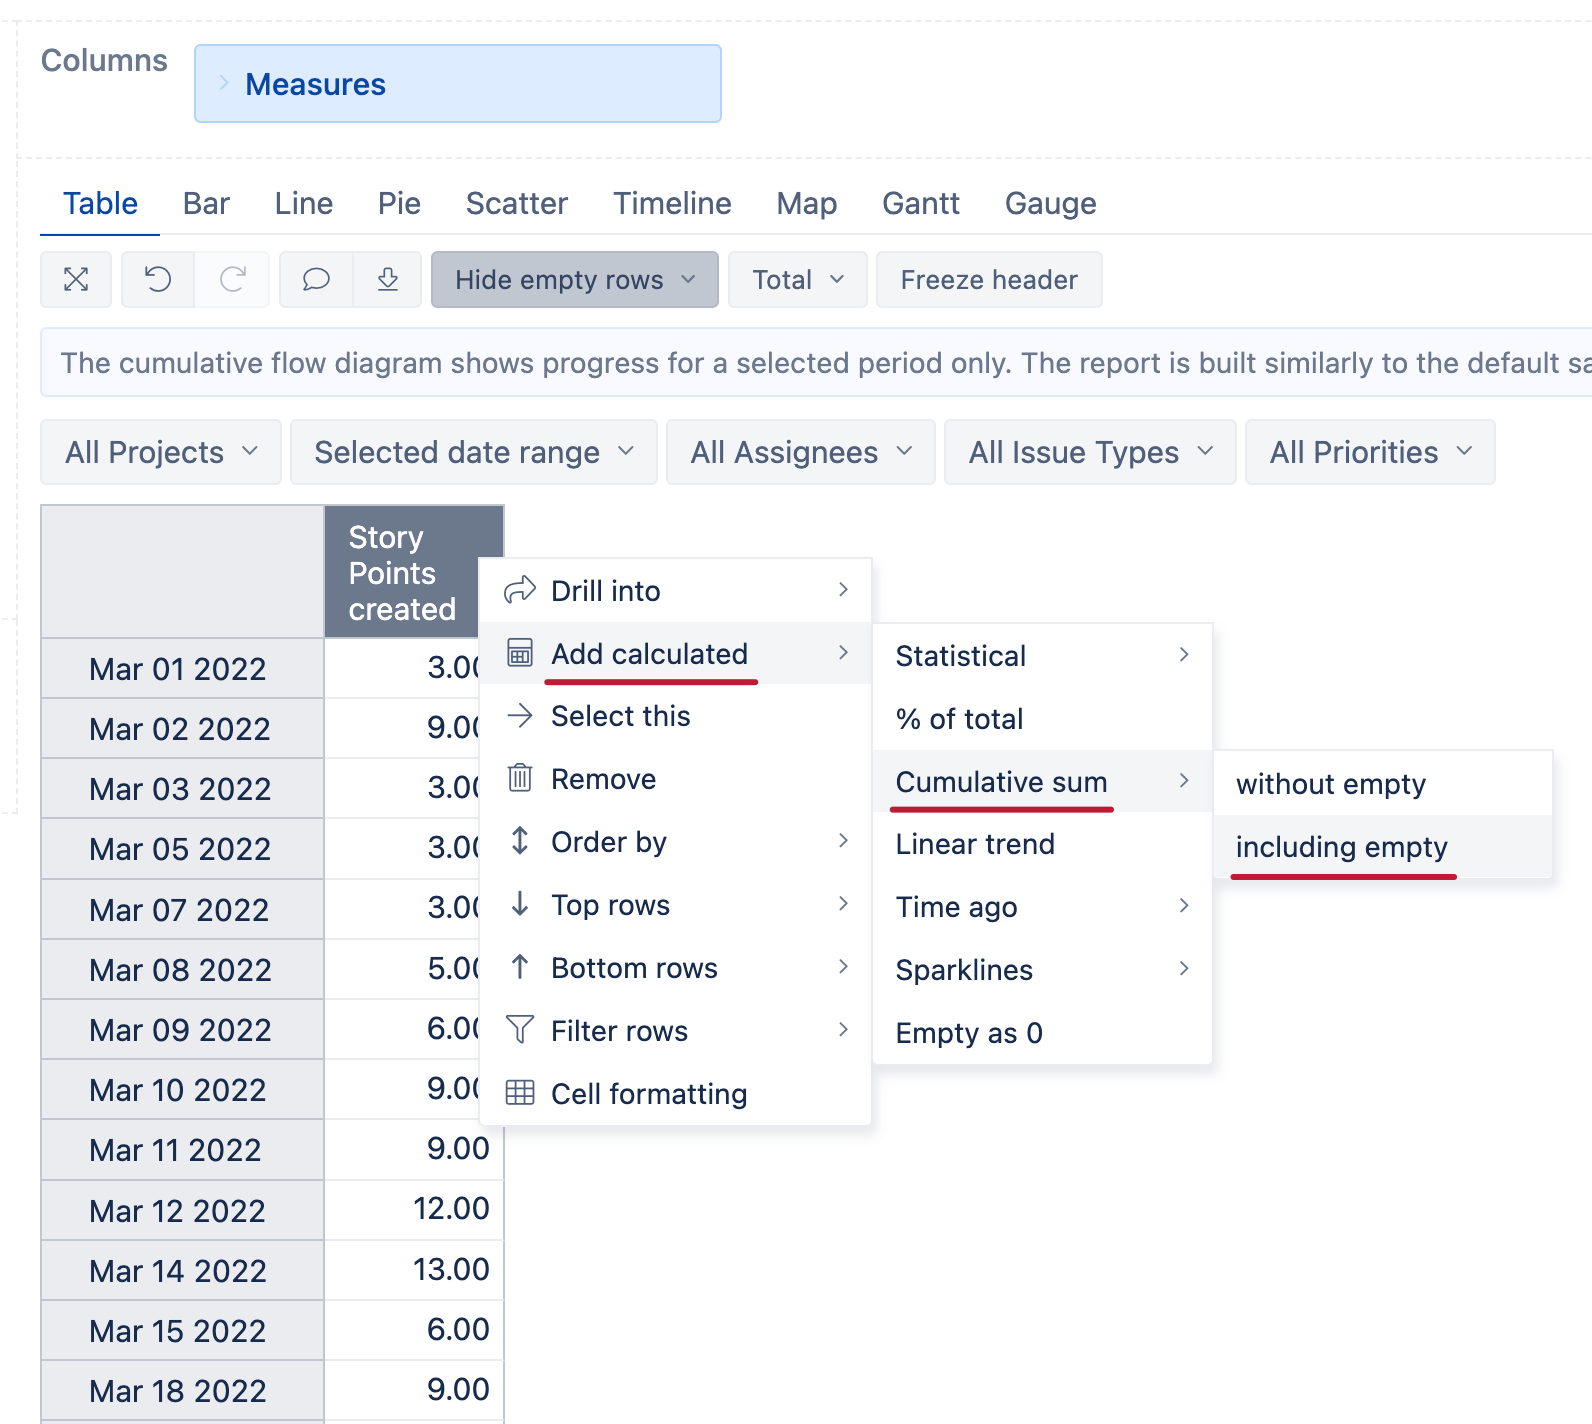
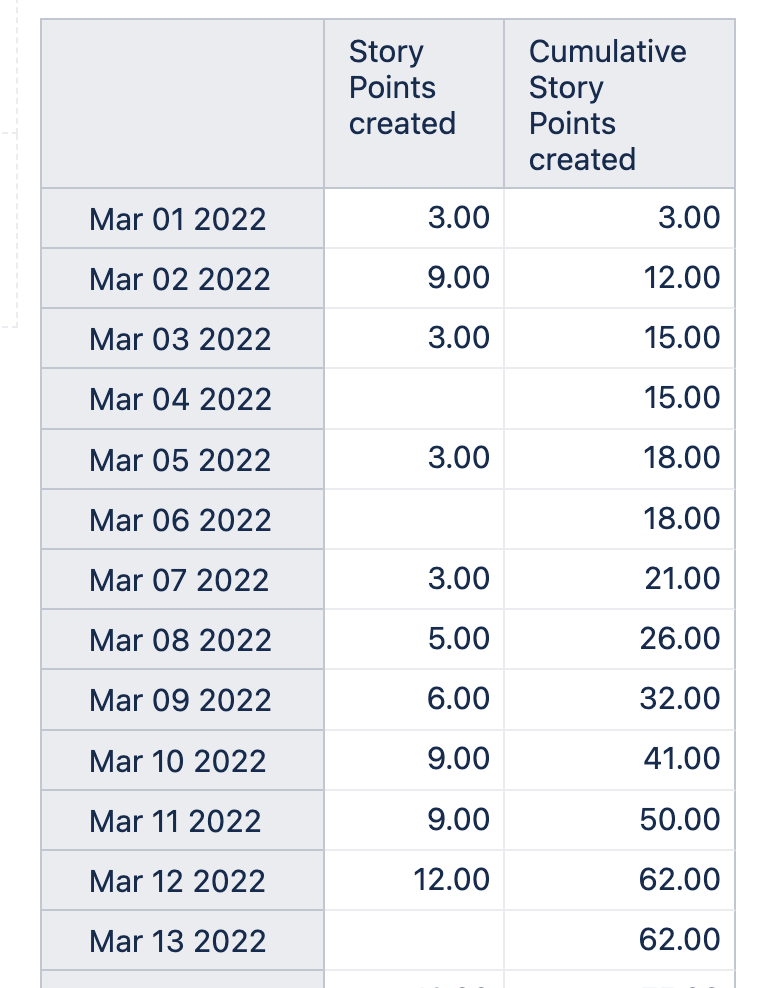
Did you try selecting your custom measure, for example, “Story Points created” and then adding the calculated cumulative sum (including empty)?
This will retain the cumulative value even for those dates when no additional value was recorded.
Create this cumulative measure (including empty) for all the numeric fields that you wish to show in your report and then define a new calculated measure in the Measures dimension that will sum up all the cumulative values with a formula like this:
[Measures].[Cumulative Story Points created]
+
[Measures].[Cumulative Epic Points created]
+
[Measures].[Cumulative Feature Points created]
Let me know if this fits your use case!
Thanks!
Nauris