How to sum the daily values of a Custom Jira ticket field?

I have created a custom numerical field for a specific type of Jira tickets, call it Risk Points. I have imported that field successfully into EazyBI and can use it as Dimension. I am having issues trying to use it as a measure, specifically:

I want to sum-up, and plot over time, the daily summed value of Risk Points for all of the open issues of a specific project over a specific time period.

Example.

                                                             0              1              2                3 (Risk Point value)   Sum

Project A Ticket Type B March 25 2 3 4 1 11
Project A Ticket Type B March 26 1 2 3 0 8
Project A Ticket Type B March 27 0 3 1 0 5

I’ve watched a number of the videos and read some of the reference material but simply cannot piece this together in the calculated measures MDX Editor.
Hi @Adam_hollow,

A warm welcome to the eazyBI community. I am sorry your question didn’t get any attention for the last two weeks.

By default, numeric fields can be imported as measures. To import them as a dimension, you have to make some adjustments in the eazyBI advanced settings. Once the field is imported as a measure, it will be tied to specific issue dates. That will tie the values to the Time dimension in the report. You can read more about it on our documentation page - Jira custom fields.

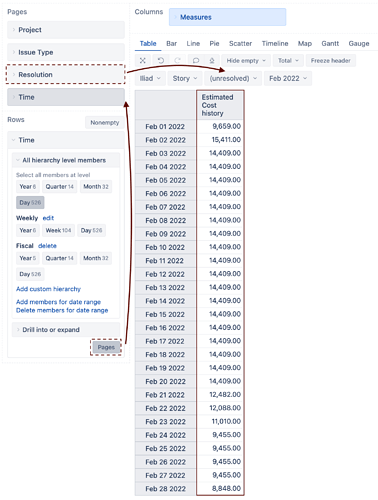
The measure I recommend is “Risk Points history”. It should be available for import with the issue change history enabled - Import issue change history. Please see the suggested report structure below:


In such a report, you can see the cumulative changes of the field value for unresolved issues over time.

Best,
Roberts // support@eazybi.com

Thanks for reply. It wasn’t the answer to my question but led me to it (importing my custom field as a measure)! I didn’t give enough detail in the first request.

1 Like