Issue Resolution histogram excluding time blocked

Hi all,

I’m trying to modify an existing bar chart that currently does the following things:

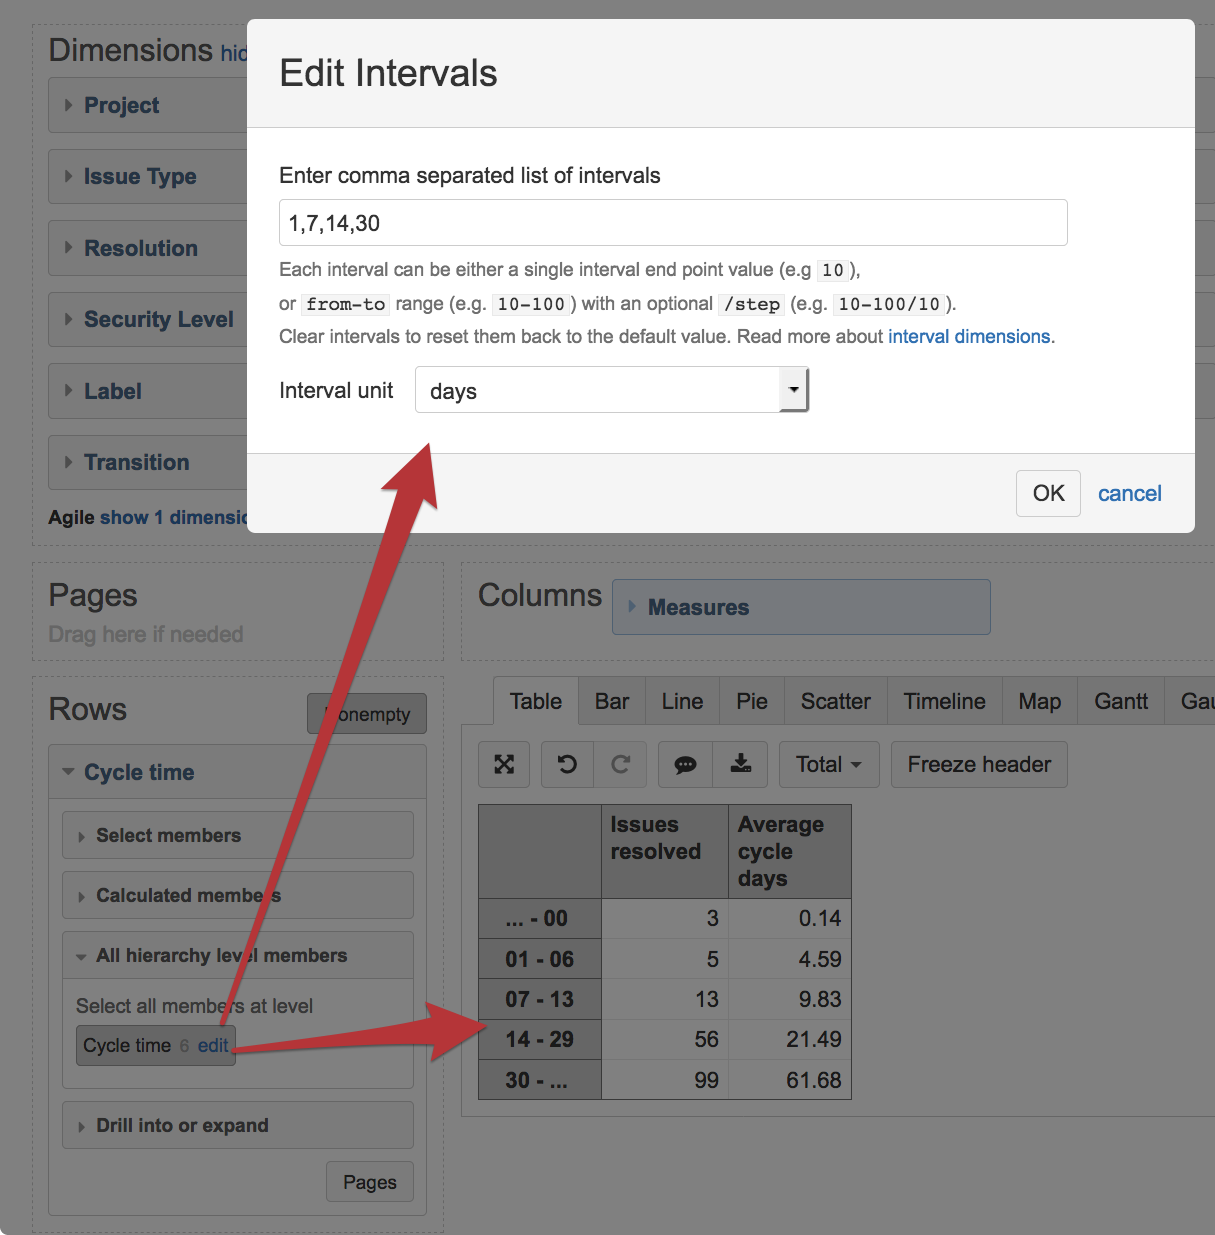
  • Displays a count of all issues resolved in a JIRA project over a set period of time
  • Shows the average resolution time of issues
  • Shows a histogram breaking down how many issues were solved in set periods of time (i.e. less than a day, 1 day to 7 days, 8 to 14 days, etc)

Unfortunately due to time that issues have spent being Blocked due to external teams the histogram view doesn’t work well to track how long tickets were actively worked.

Currently the chart is using Issue Type for the Columns (to exclude out Epics, which were skewing data), and Measures for Rows using a variety of custom defined Calculated Members to select out issues Resolved at set intervals.

Example: this is what is set up for the “resolved between 1 and 7 days” calculated member.

CASE WHEN [Measures].[Issues resolved] > 0 THEN
NonZero(Count(
   Filter(
Descendants([Issue].CurrentMember, [Issue].[Issue]),
 DateInPeriod([Issue].CurrentMember.get('Resolved at'),
  [Time].CurrentHierarchyMember) AND
  ([Measures].[Issues resolved],
  [Time].CurrentHierarchy.DefaultMember) > 0 AND
DateDiffDays([Issue].CurrentMember.get('Created at'),
  [Issue].CurrentMember.get('Resolved at')) >= 1 and
DateDiffDays([Issue].CurrentMember.get('Created at'),
  [Issue].CurrentMember.get('Resolved at')) <= 7
  )
 ))
END

What do I need to add in (and where) to have this accurately remove time issues spend being blocked? I’ve been trying to figure this out for several weeks and I’m stumped.

Thanks in advance for your assistance!

1 Like

Would anyone happen to have any insights into how I might possibly be able to do this?

Thanks!

We suggest using Interval dimensions when possible to count issues solved/open in a set of periods of time.

Resolution intervals

For your current calculation on resolution days you can use default Resolution interval dimension. You would like to select interval dimensions for import in an account as this is no default import option. You can set intervals 1,7,14 … etc. eazyBI will create corresponding interval members.

Here is an example report on our demo account for resolution interval usage:

https://eazybi.com/accounts/1000/cubes/Issues/reports/52456-issue-resolution-time-intervals-bar

Custom intervals

You can reuse your current calculation on Issue level subtracting days in transition status for transitions status blocked from current resolution time. However, I would suggest calculating this value with calculated JavaScript custom field and importing it as a measure and interval dimension.

JavaScript calculation for custom interval - cycle time

Here is an example of calculated JavaScript custom field counting a cycle time for all open statuses except Blocked.

[jira.customfield_cycle_time]
name = "Cycle time"
data_type = "decimal"
dimension = true
measure = true
javascript_code = '''
var cycle = null;
var datefrom = Date.parse(issue.fields.created);
resolution = false;
var NotInStatuses = ["Blocked"];
if (issue.fields.resolutiondate) {
issue.changelog.histories.forEach(function(history){
 history.items.forEach(function(historyItem){
   if (historyItem.field == "status") {
      status = historyItem.fromString;
      if (!resolution) {
        dateto = Date.parse(history.created);
        if(NotInStatuses.indexOf(status) == -1){
          cycle += (dateto - datefrom) / 1000/ 60 /60 / 24 ;
        }
        datefrom = dateto;
        status = historyItem.to;
      }
    }
    if (historyItem.field == "resolution") {
      if (historyItem.to) resolution = true;
      else resolution = false;
    }
 });
});
 
if (issue.fields.resolutiondate && NotInStatuses.indexOf(status) == -1) {
  cycle += (Date.parse(issue.fields.resolutiondate) - datefrom) / 1000/ 60 /60 / 24 ;
 }
 
issue.fields.customfield_cycle_time = cycle;
}
'''
time_unit = "days"
time_interval = "duration"
intervals = "1,7,14,30"
interval_unit = "days"
  1. Add the custom field definition to eazyBI advanced settings or ask Jira administrator to do this for you. eazyBI advanced settings are common for all accounts, and only Jira administrators have access to the settings.

  2. Open source data Jira import options for edit after changes in advanced settings and select the custom ​field for import as a dimension and as a measure and run an import.

Building reports with interval dimensions


You can change intervals for a dimension with edit option. However, eazyBI has only one set of intervals per account.
Interval example:
… - 0 shows time <=1
01-06 shows time >1 and <=7
07-13 shows time >7 and <= 14
30 - … shows time over 30 days

I used a calculated measure for Average cycle days calculation:

CASE WHEN [Measures].[Issues resolved] > 0
THEN
[Measures].[Cycle time resolved] / 
[Measures].[Issues resolved]
END

Daina / support@eazybi.com