Hi! I want to see the average of hours spent group by “Issue Story Points” but always i have to configure the report with Issue in Rows Axis.
How can i get the next report:
Issue Story Points | Average Hours Spent
Thanks!!!
Hi! I want to see the average of hours spent group by “Issue Story Points” but always i have to configure the report with Issue in Rows Axis.
How can i get the next report:
Issue Story Points | Average Hours Spent
Thanks!!!
Hi!
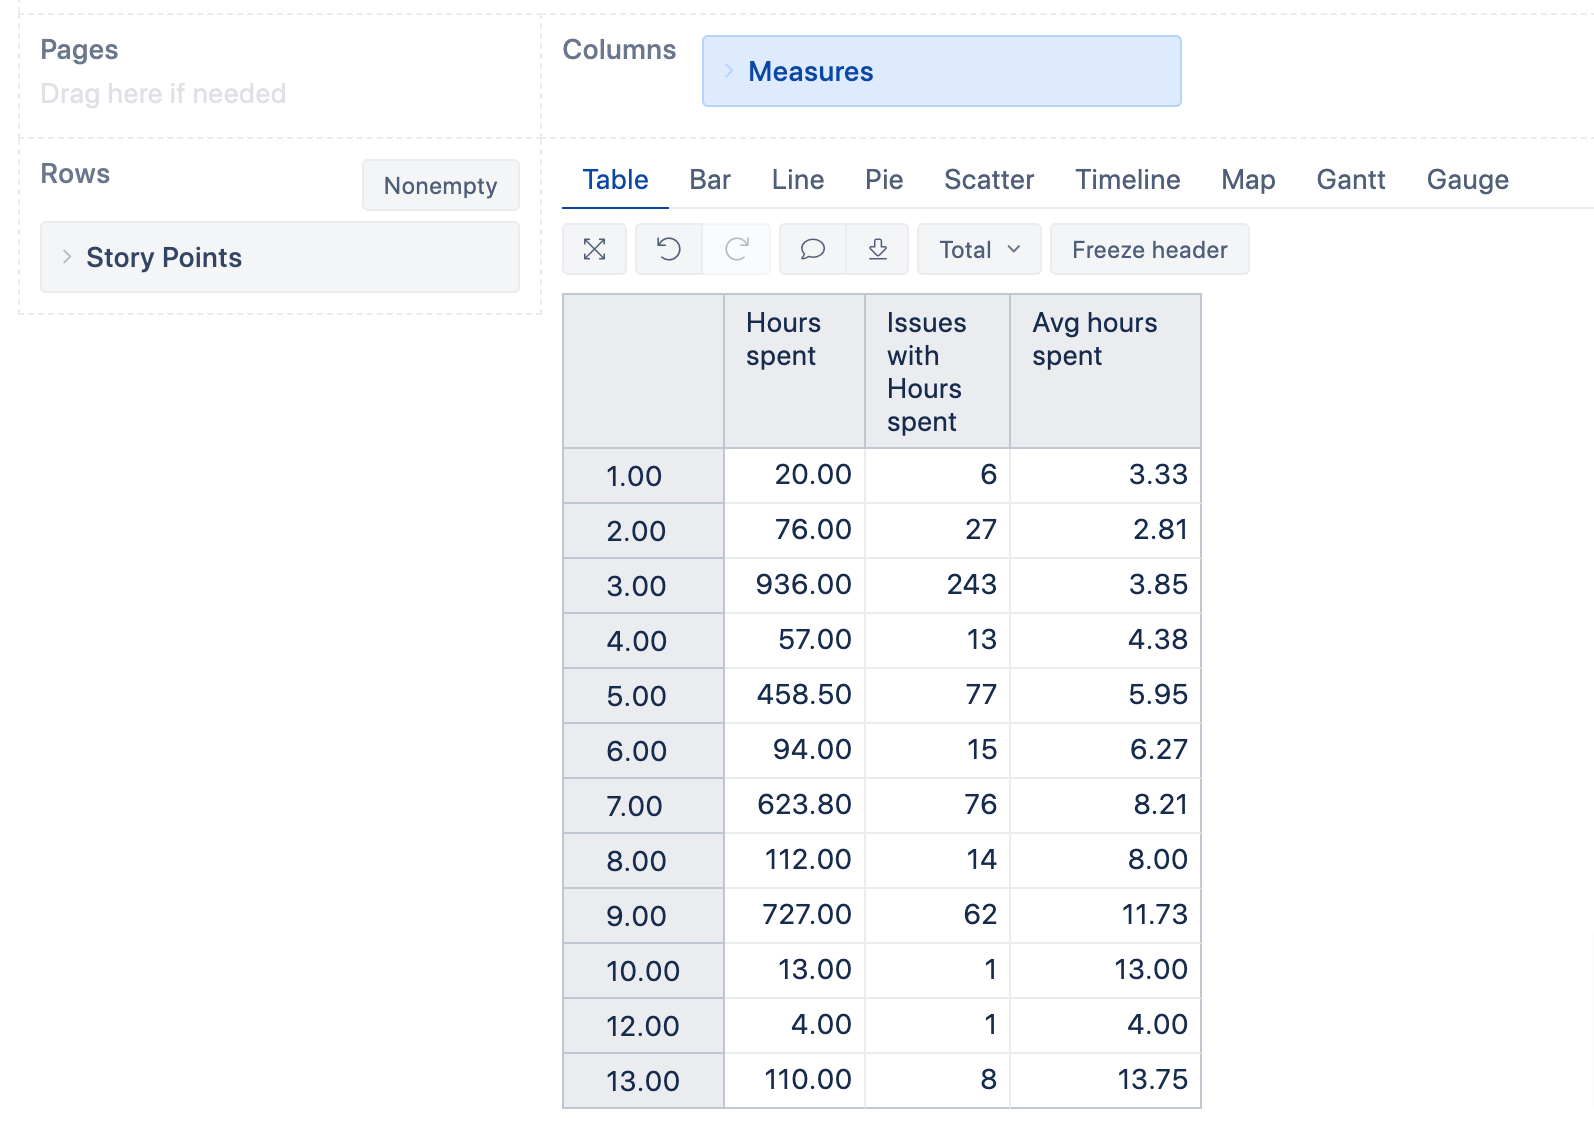
You may start with importing “Story Points” field as a dimension: read here how to do that in another community thread: Number of issues with "x" story points
Add this dimension in the report rows. Use measure “Hours spent” to show how many hours where spent for issues with different story points.
For the average hours spen: what kind of average you want to calculate?
For the average logged hours within the issues with the same story points, you may create a new measure (in Measures) where you divide logged hours by the number of issues with logged hours. Calculation formula for such a measure:
CASE WHEN
  [Measures].[Issues with Hours spent]>0
THEN
  [Measures].[Hours spent]
  /
  [Measures].[Issues with Hours spent]
END
See an example of the final report:
Best,
Ilze LA, support@eazybi.com