Hi,
We’ve got some charts that plot linear trends using the “Add calculated | Linear Trend” option.
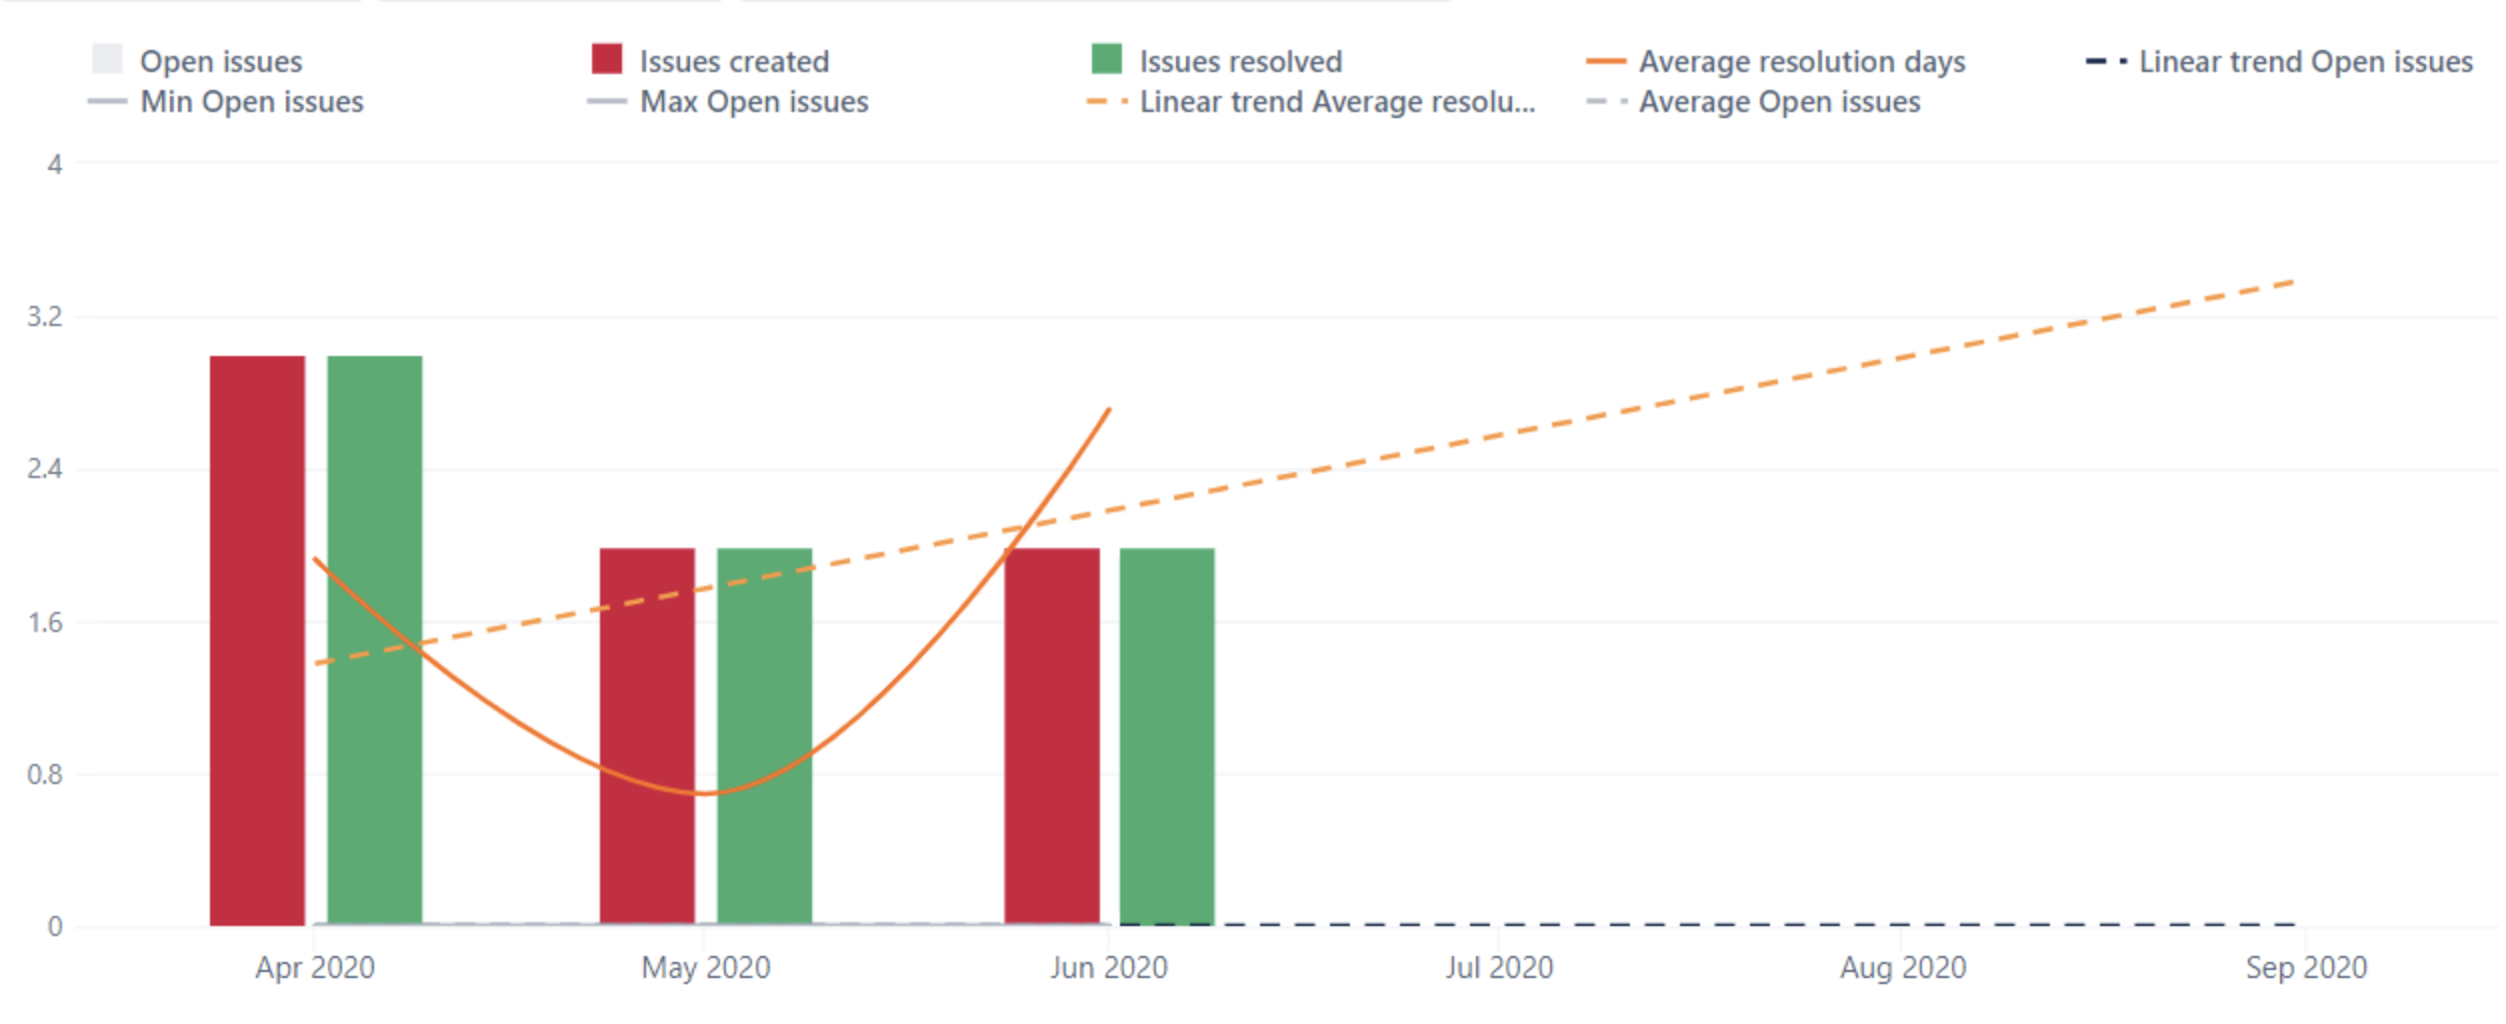
You can see the orange trends in the chart above.
Is it possible to treat the “no data” months as zero in the linear trend calculation?
Thanks,
adam
Hi,
We’ve got some charts that plot linear trends using the “Add calculated | Linear Trend” option.
You can see the orange trends in the chart above.
Is it possible to treat the “no data” months as zero in the linear trend calculation?
Thanks,
adam
Hi, @adam.gilmore,
The trend line shows projection for the periods visible in the chart based on the periods that have data. It is the intended functionality. (Linear trend shows value for empty data)
You may either limit visible periods to the periods with data. Enable option Nonempty. Or filter rows by measure Issues resolved > 0.
Another option is to create a new calculated measure for each linear trend. The formula for a liner then would be similar to the existing formula but with the additional condition to show values for those periods where measures have some values. For example, the customized calculated measure for "Linear trend Issues resolved"might look like this (the addition to the existing formula generated by eazyBI is the second line):
CASE WHEN CurrentTuple(VisibleRowsSet()).Item(0).Name <> '$total_aggregate'
  AND [Measures].[Issues resolved] > 0
THEN
 ..
END
Best,
Zane / support@eazyBI.com