I’d love to map Jira data based on the associated geolocation of an Organisation.
I don’t want to duplicate the geolocation data for an Organization, so is there a way to set this geolocation data in a spreadsheet, import that into EazyBi and use that geolocation data to map Jira issues based on the Organization of an issue?
Yes, you can represent Jira issues based on Organization geolocation.
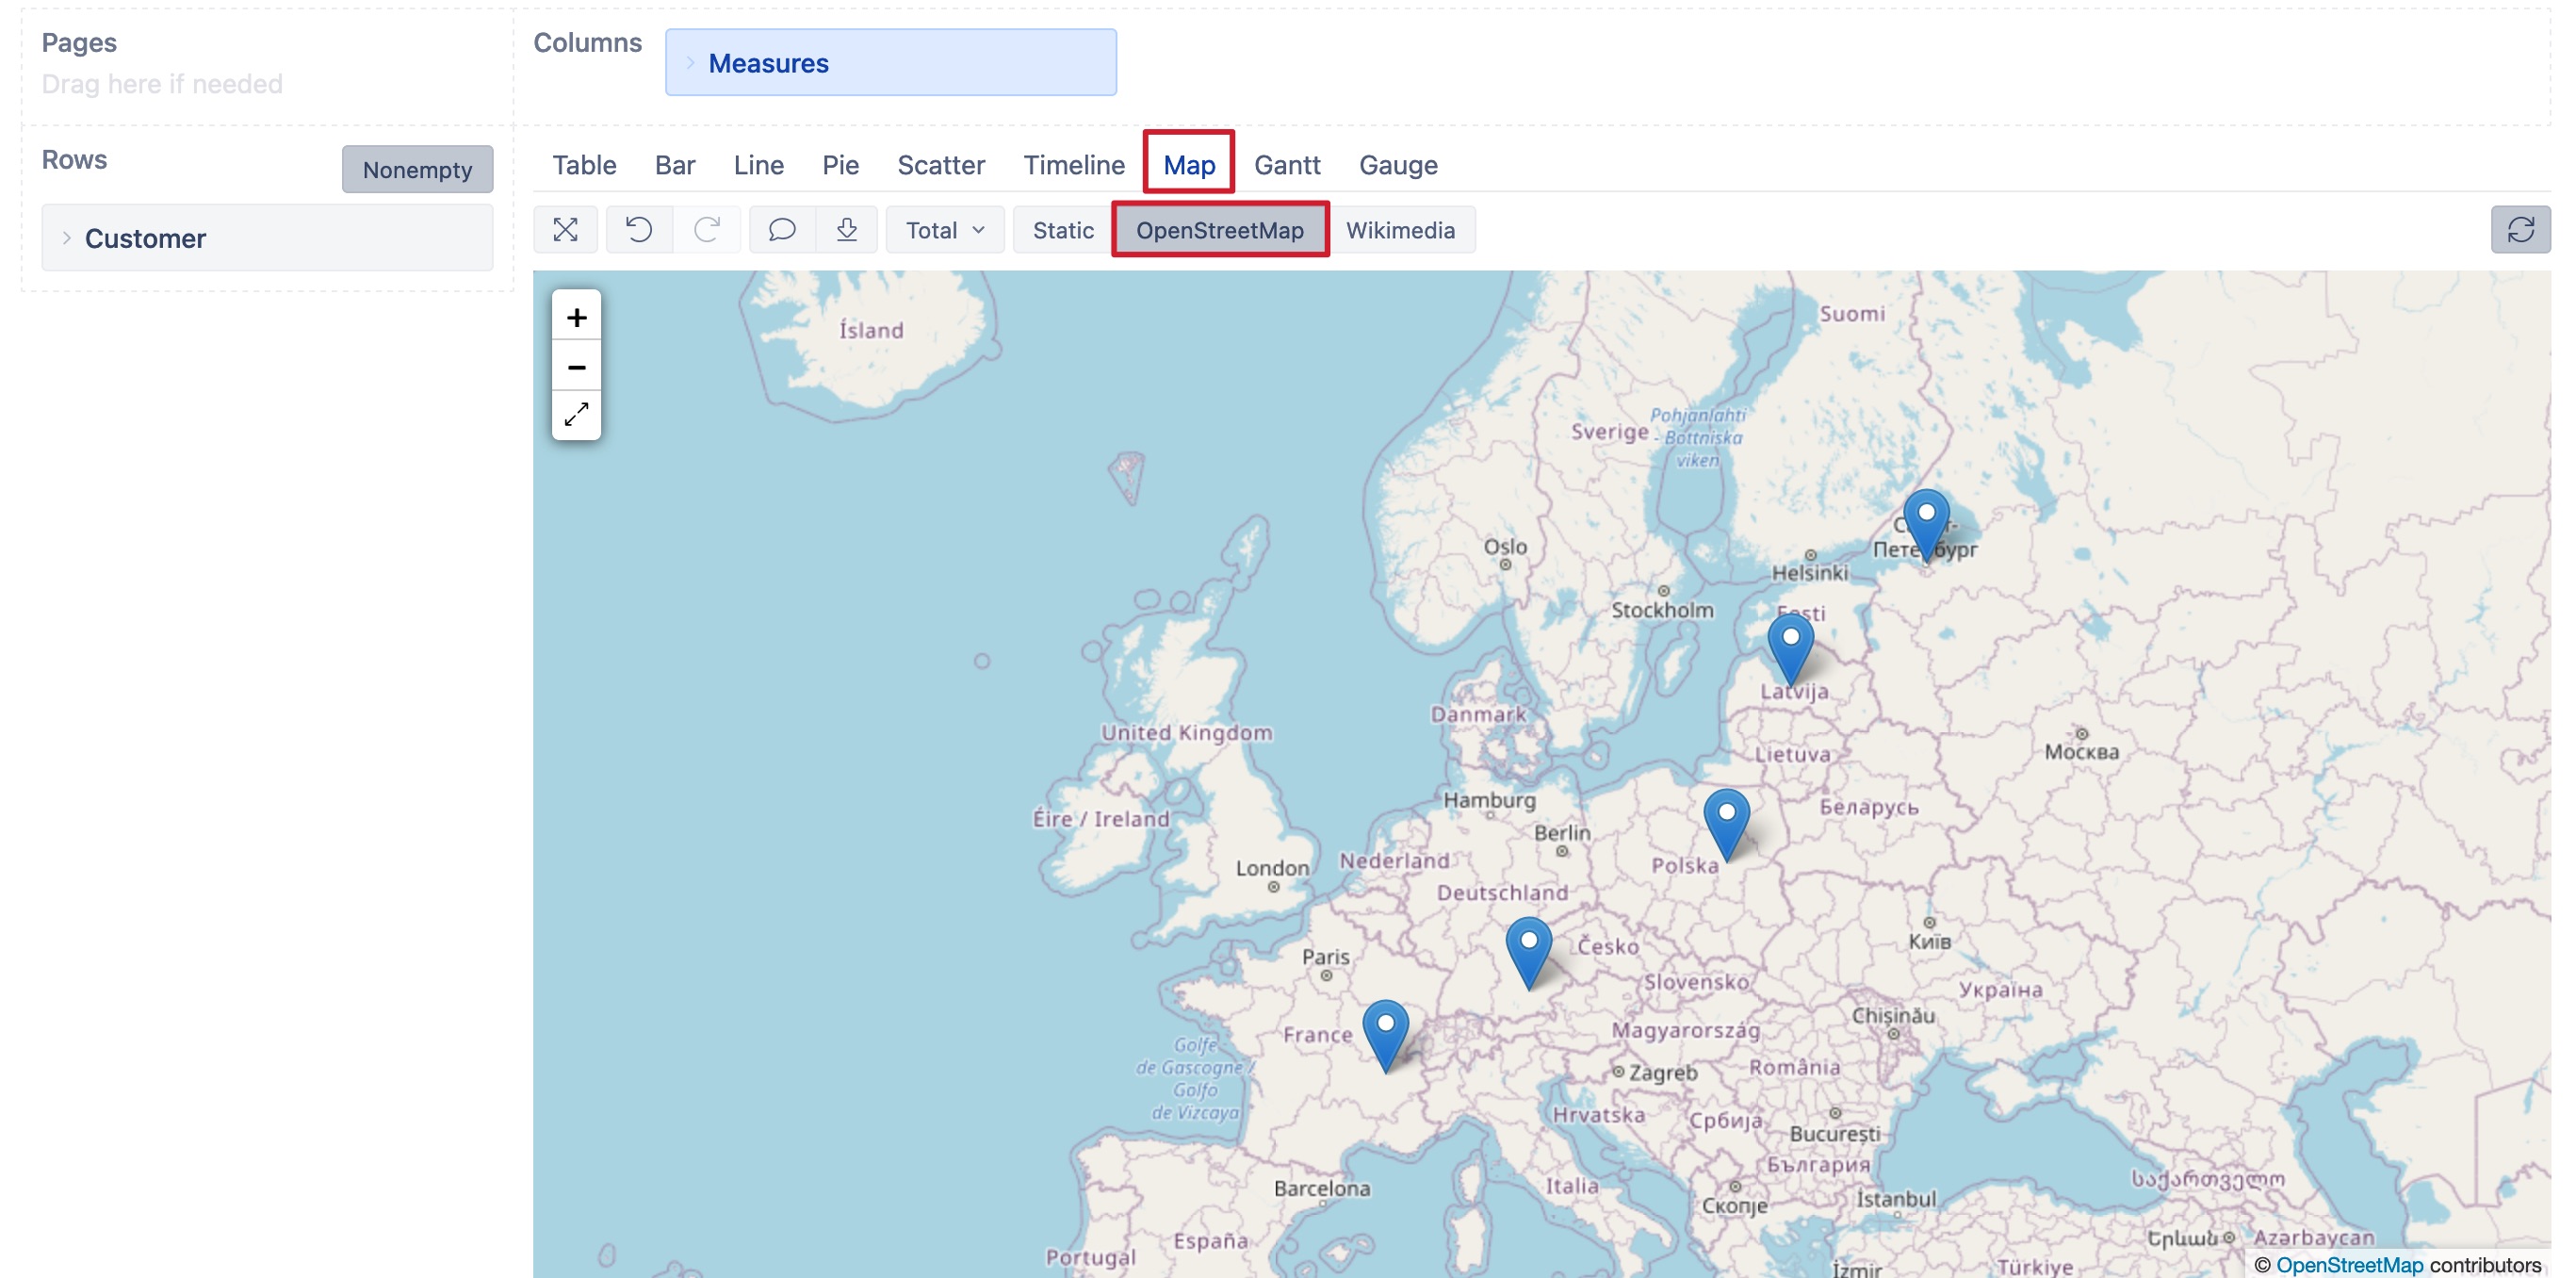
Import latitude and longitude coordinates for each Organization as properties. And then, you can show issues by organizations on the dynamic Map chart.
For example, if the Organization is a single-select custom field in Jira and you have information on each organization location in jira or some other system.
In eazyBI advanced settings, define to import the custom field “Organization” in a separate table.
The code might look like this, where NNNNN is a custom field ID in Jira:
Perform double data import to ensure the Organization is correctly imported.
First, in the import option, deselect custom fields “Organization” from data import and import data. This action will clear the previous data and data structures. Wait for data import to complete. Then select the custom field “Organization” for data import and import data for the second time.
The first two steps ensure that you can import additional data (latitude and longitude) to the Organization.
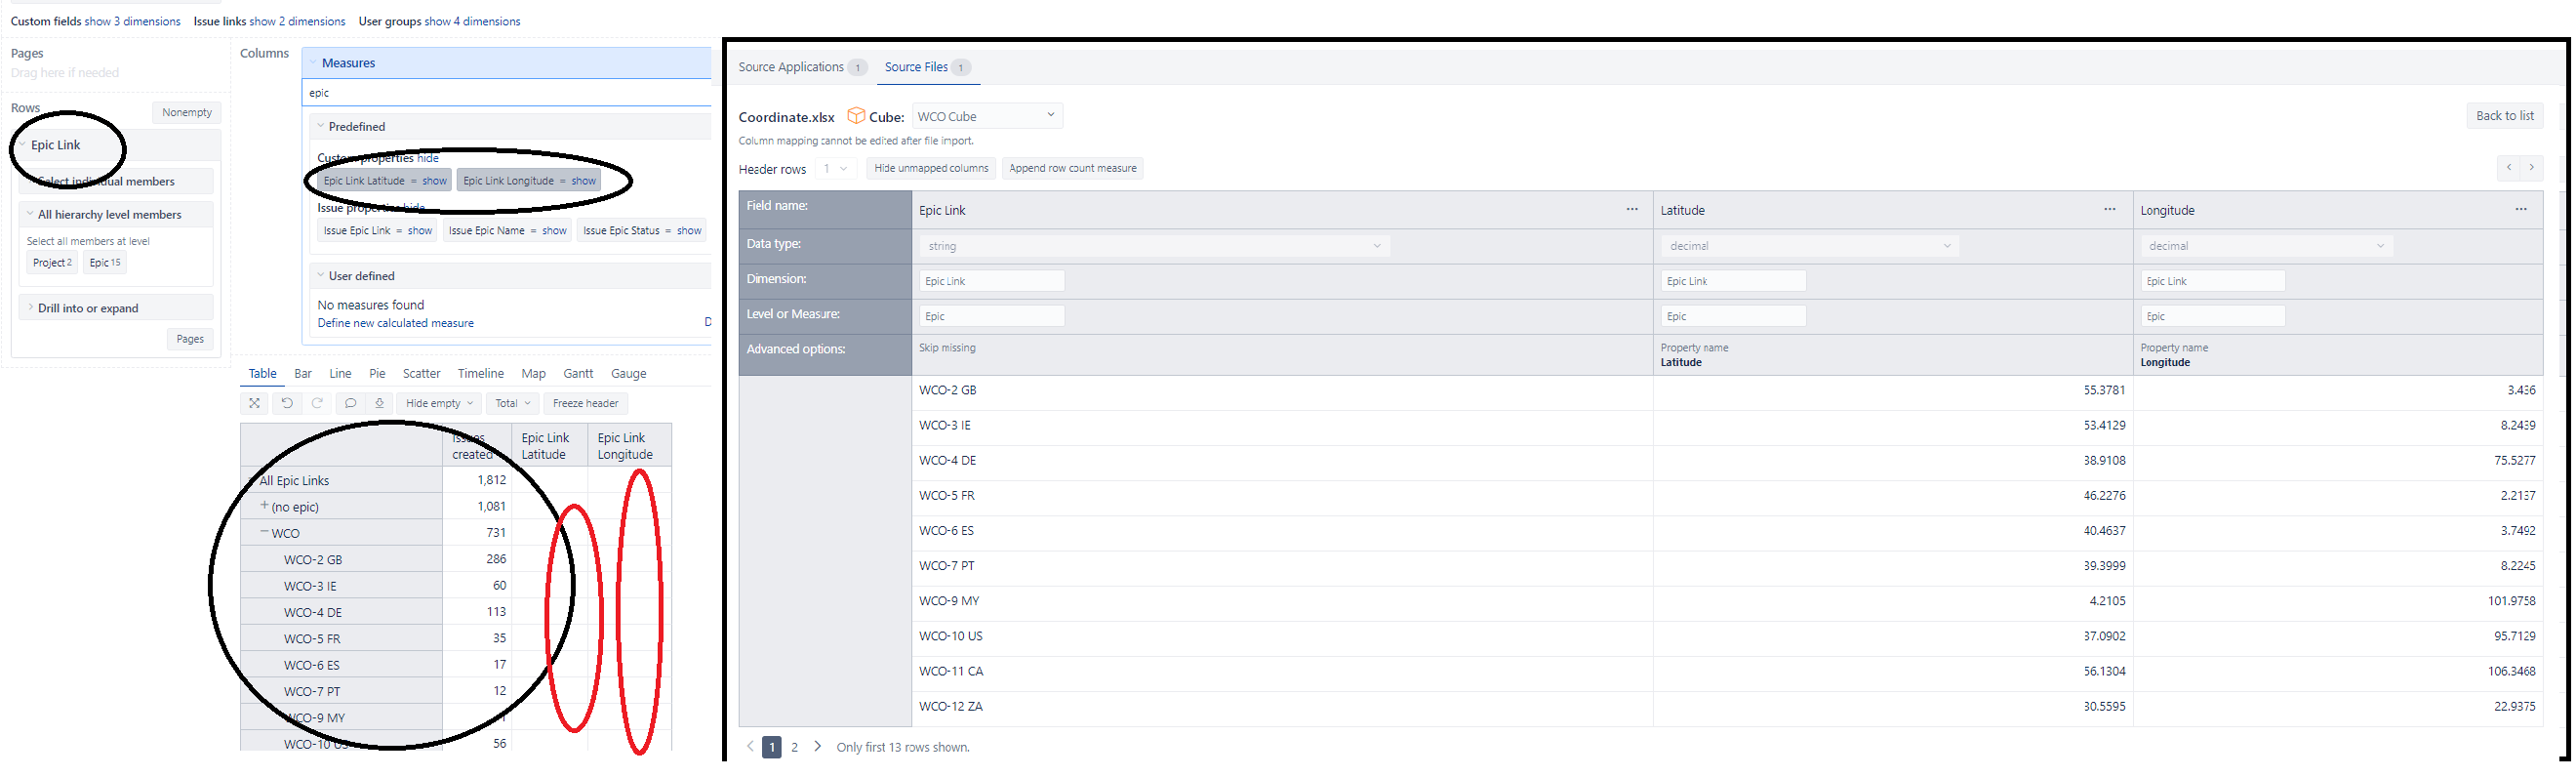
Import geolocation of each Organization with additional data import . The data source should contain three columns:
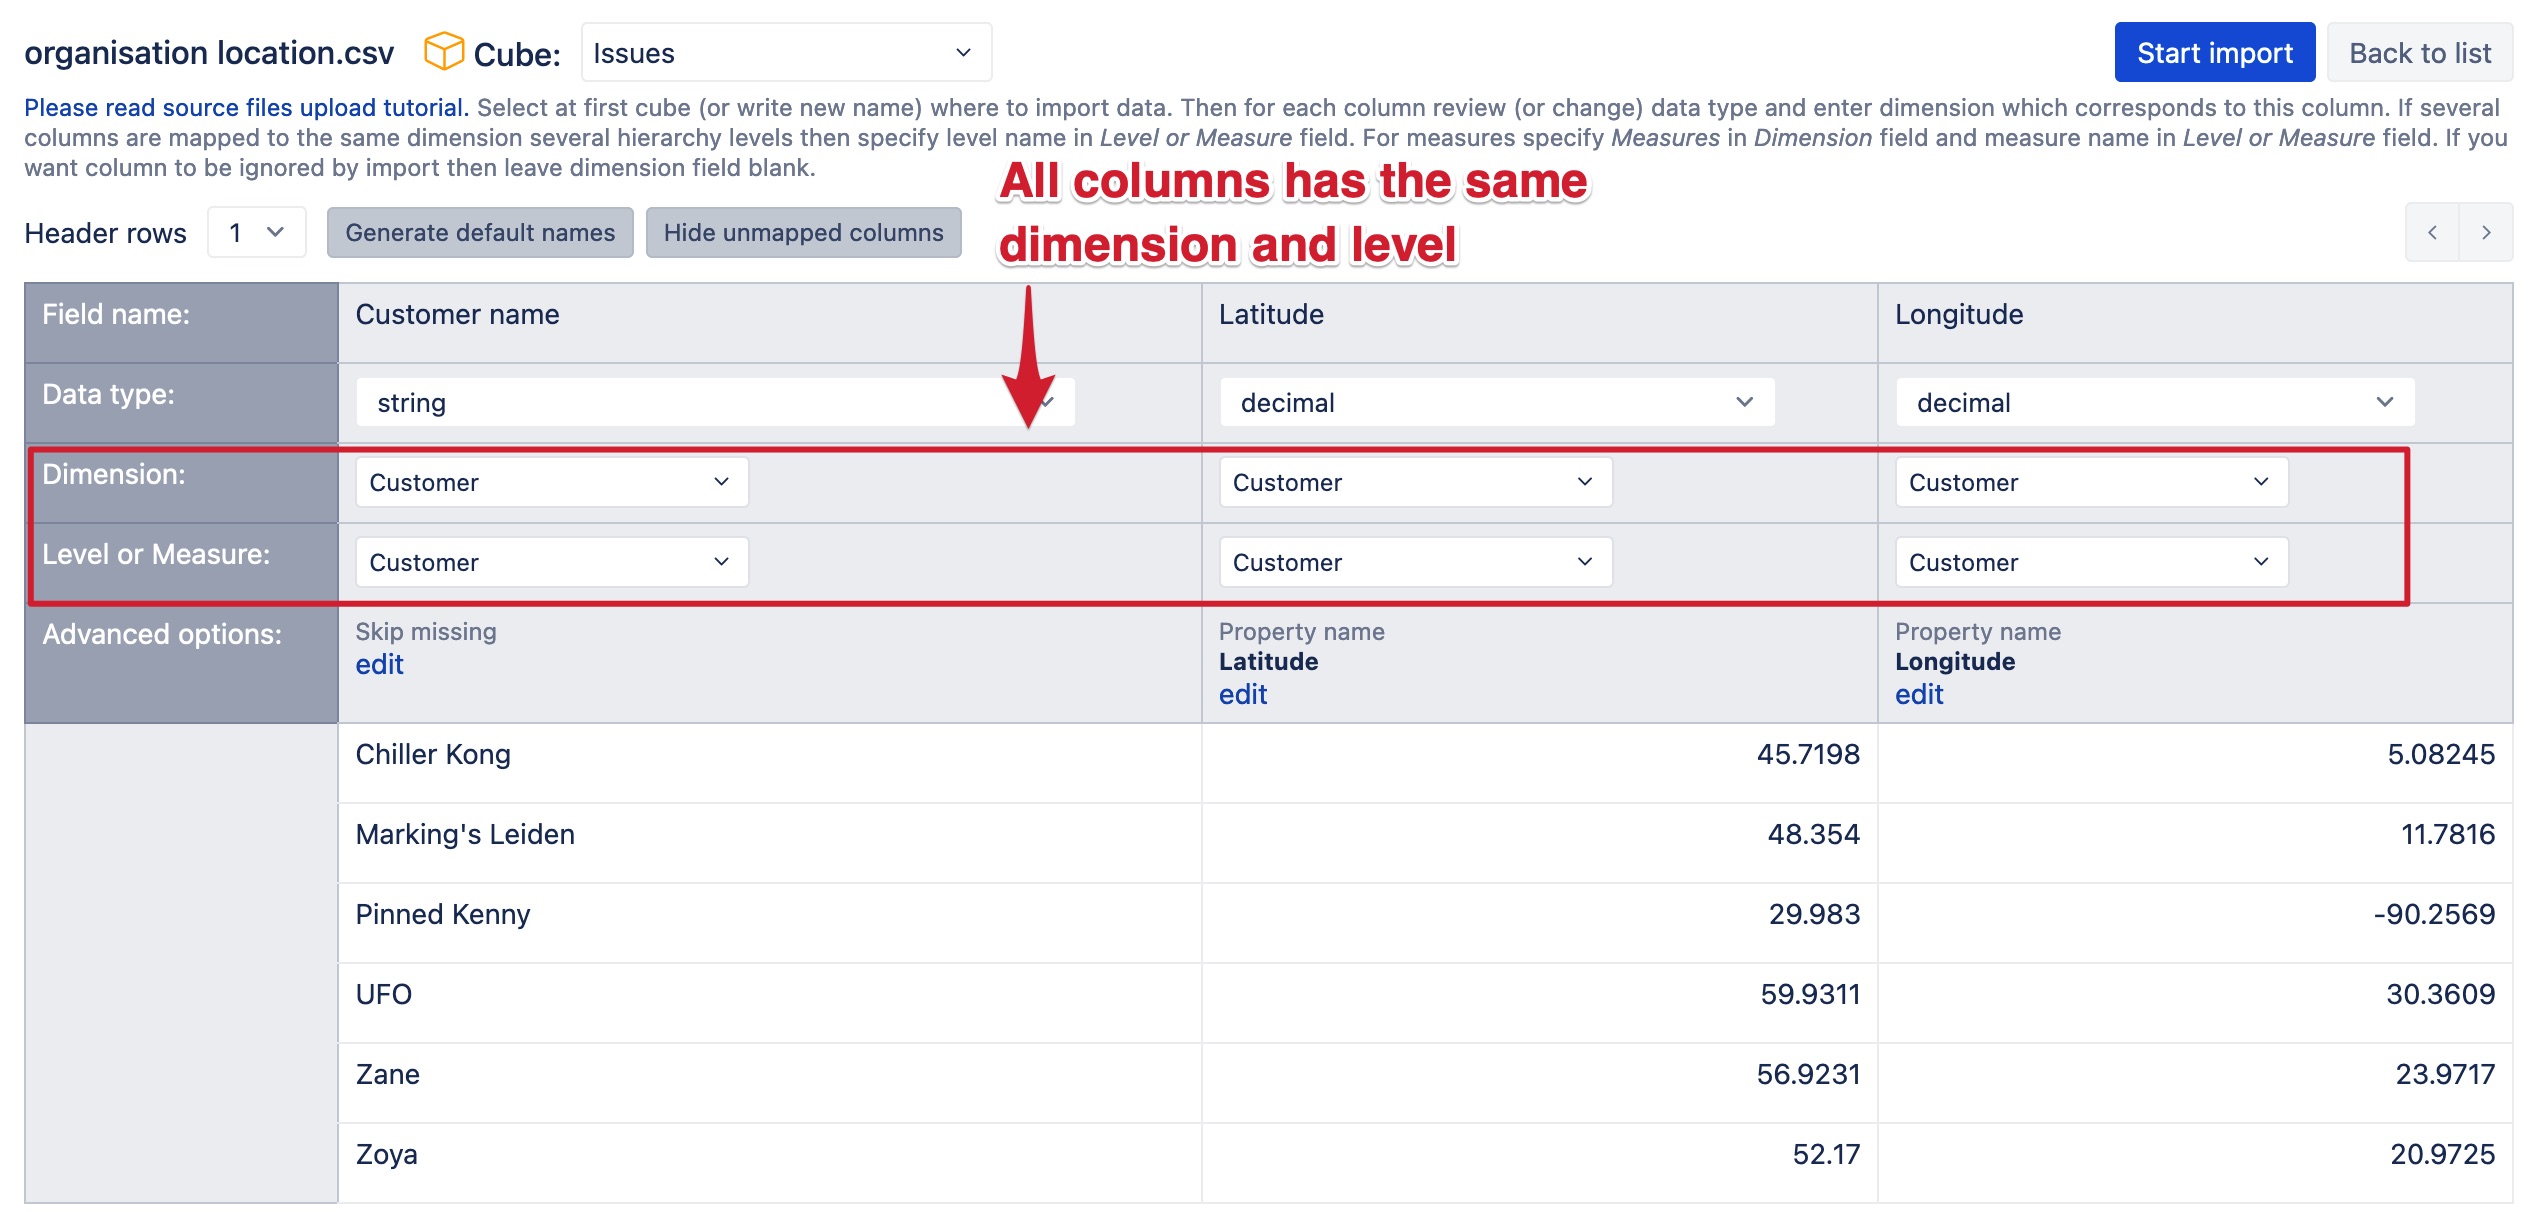
Organization name as you see it in eazyBI. Map this column to the dimension Organization, level Organization. In advanced options, mark to “Skip missing”.
Latitude of geolocation. Map this column to the dimension Organization, level Organization, but in advanced options, enter the property name “Latitude”.
Longitude of geolocation. Map this column to the dimension Organization, level Organization, but in advanced options, enter the property name “Longitude”.
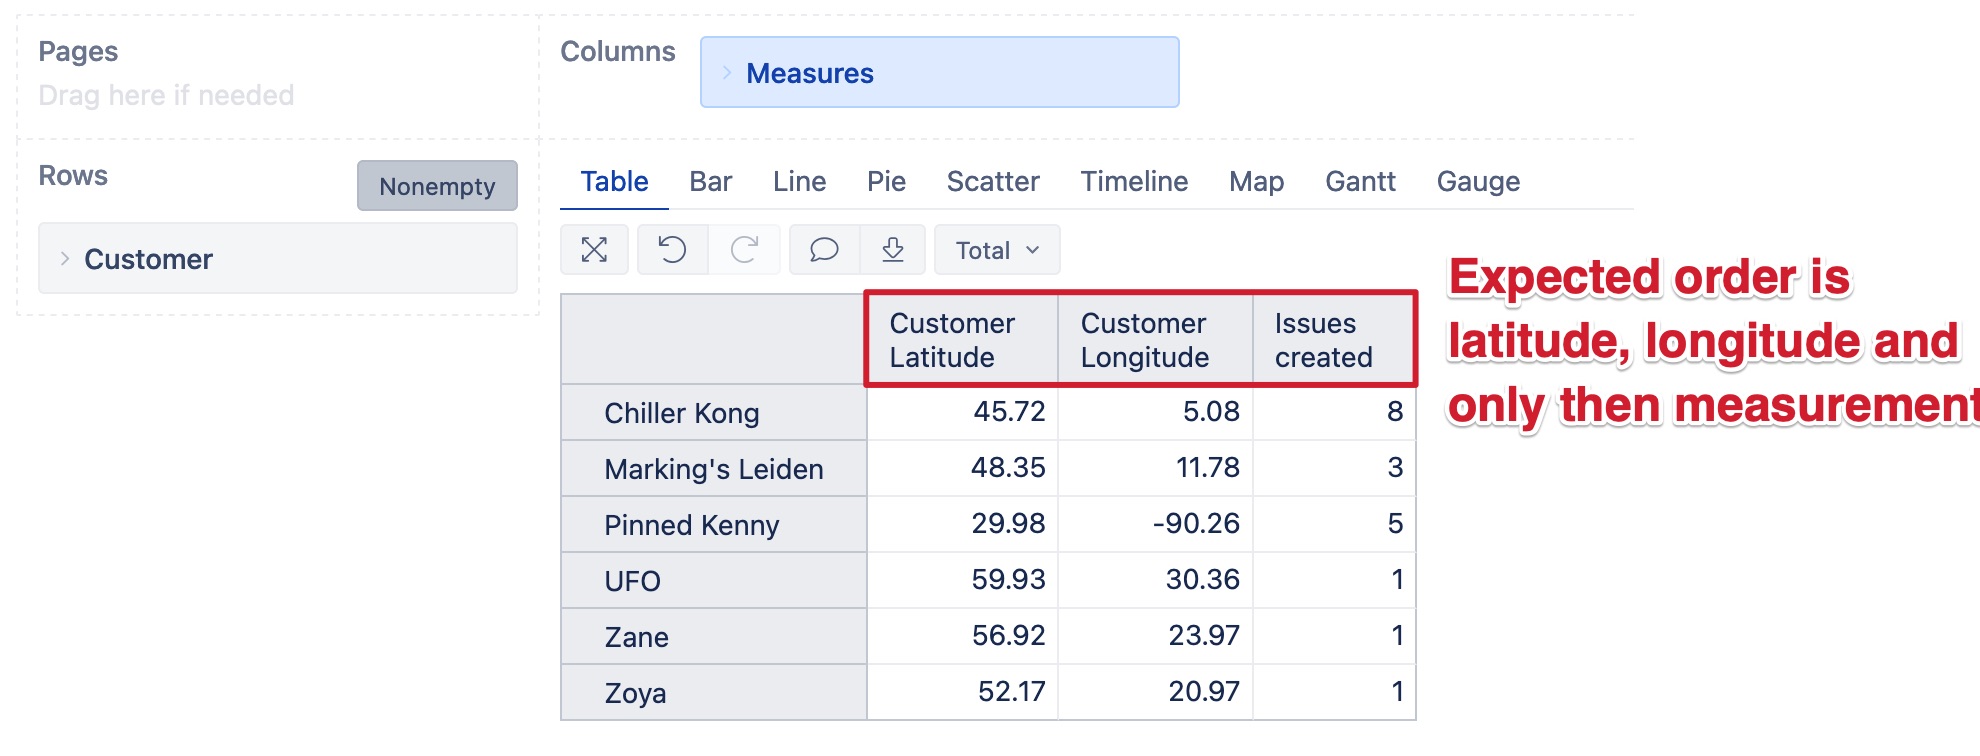
In the report, set dimension “Organization” on report rows. And select custom properties latitude and longitude as the first columns in the report. And the measure representing issues should follow as the 3rd column.
I’ve tried this various ways. Stopped and come back to it but keep getting stuck on the import.
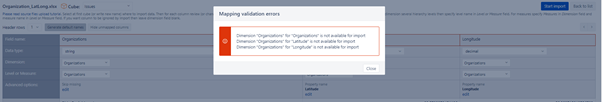
I get a message saying:
Mapping validation errors
Dimension “Organizations” for “Organizations” is not available for import
Dimension “Organizations” for “Latitude” is not available for import
Dimension “Organizations” for “Longitude” is not available for import
The “Organizations” field is a Dimension which is created by Jira Service Desk I believe.
I created the separate table for Organizations based on the advice given.
Any suggestions or highlight my mistake(s) would be gratefully received.
Of all the charts I’ve shown my senior stakeholders so far the map function is their favourite, so keen to get this working.
My example was based on a single select custom field therefor it worked.
On the other hand, the service desk custom field “Organization” is a multi-selection field and additional data import is not supported, unfortunately. Therefore data import fails as it is not supported.
If you have a relatively small amount of organizations, then you may try another approach to show Organization latitude and longitude in the report.
Define a new calculated measure in Measures “Organization latitude” to show the latitude coordinates based on the Organisation name on report rows. For the calculation use condition CASE WHEN organization name is A THEN latitude is X1 WHEN name is B THEN latitude is X2 END.
The expression might look like this:
CASE [Organizations].CurrentMember.Name
  WHEN "Big Blue Planet" THEN 45.7198
  WHEN "Men in Black (MIB)" THEN 48.3540
  WHEN "UFO" THEN 59.9311
  WHEN "Milky Way" THEN 56.9231
  WHEN "The Restaurant at the End of the Universe" THEN 52.1700
END
Define another calculated measure “Organization longitude” using a similar formula with longitude values.
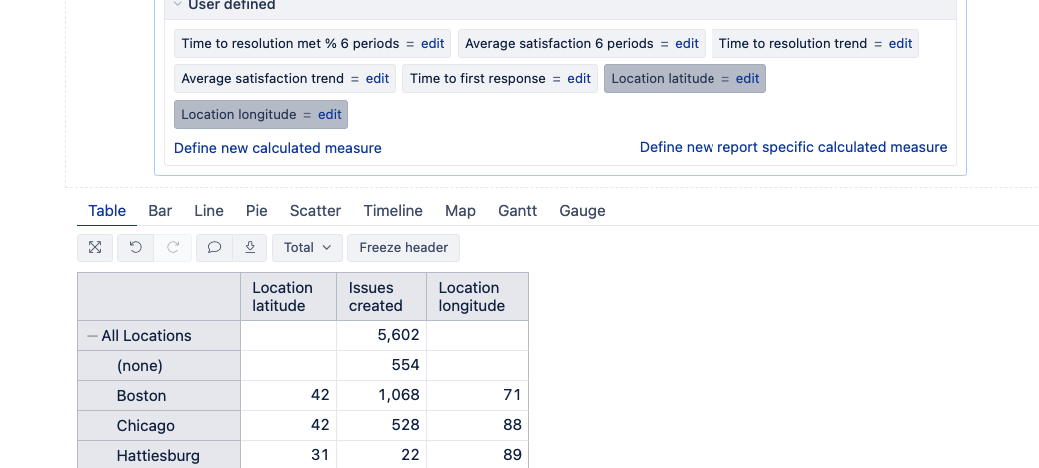
In the report, set dimension “Organization” on report rows. And select calculated measures for latitude and longitude as the first columns in the report. And the measure representing issues should follow as the 3rd column.
Hi @zane.baranovska
Your solution is brilliant and works fantastically. We don’t have too many organizations so the calculated measure is manageable.
You have made my day!
Many thanks
Mark
@zane.baranovska I read above solution. I already have dimenstion and I try to upload Latitude and Longitude data for it . excel import was successful and I can see both new property were created but my tablet is still empty for Latitude and longitude column. Any suggestion please?
@Deepak This approach won’t work for Static maps. Static maps use dimension member names to represent data but epic names consist of issue key and country code.
Regarding data mapping, no data is imported in eazyBI because the first column contains the epic key and name. You might want to adjust the source file and keep the epic key only for the first column. This way eazyBI can find epics by their keys and import the coordinates.
Hi! @zane.baranovska
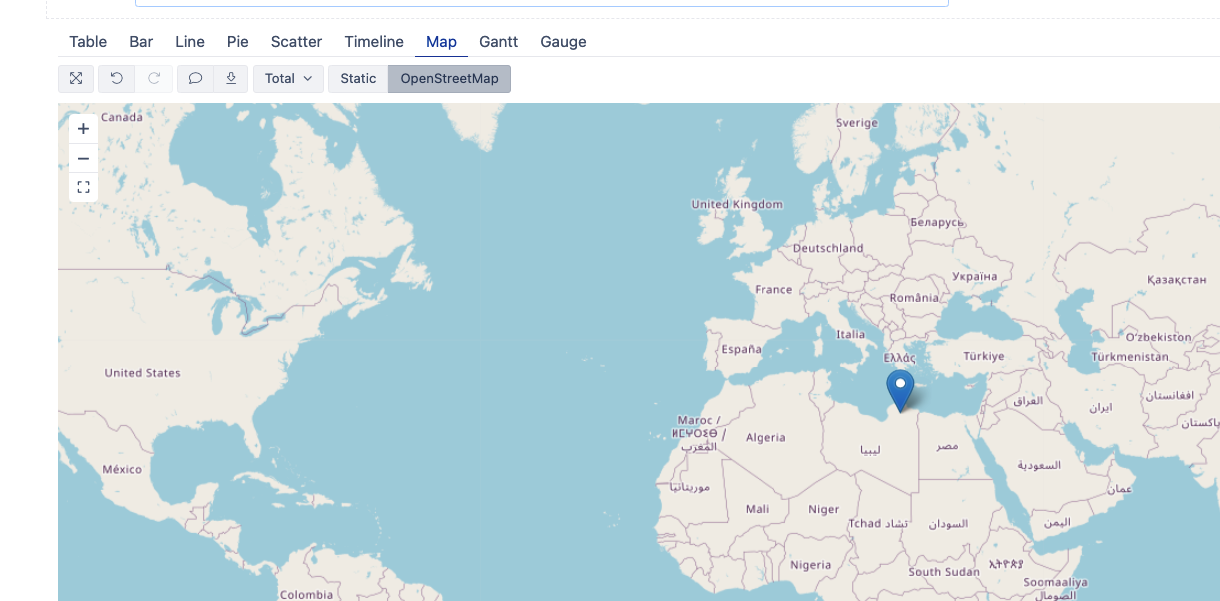
I had set the latitude and longitude and my table is ok but in the map it showing the wrong location.
I’ve checked coordinates are right.
Can someone help me with that?
For the OpenStreetMap chart, the column order is important.
You might want to switch columns with places so that the first column is latitude, then follows longitude, and only then the rest of the columns (see also documentation on Map charts: Create charts).