Hi @MarkWheeler,
Yes, you can represent Jira issues based on Organization geolocation.
Import latitude and longitude coordinates for each Organization as properties. And then, you can show issues by organizations on the dynamic Map chart.
For example, if the Organization is a single-select custom field in Jira and you have information on each organization location in jira or some other system.
-
In eazyBI advanced settings, define to import the custom field “Organization” in a separate table.
The code might look like this, where NNNNN is a custom field ID in Jira:[jira.customfield_NNNNN] separate_table = trueThere are more details on where to find and how to set advanced settings: https://docs.eazybi.com/eazybijira/data-import/custom-fields/advanced-settings-for-custom-fields.
-
Perform double data import to ensure the Organization is correctly imported.
First, in the import option, deselect custom fields “Organization” from data import and import data. This action will clear the previous data and data structures. Wait for data import to complete. Then select the custom field “Organization” for data import and import data for the second time.
The first two steps ensure that you can import additional data (latitude and longitude) to the Organization.
-
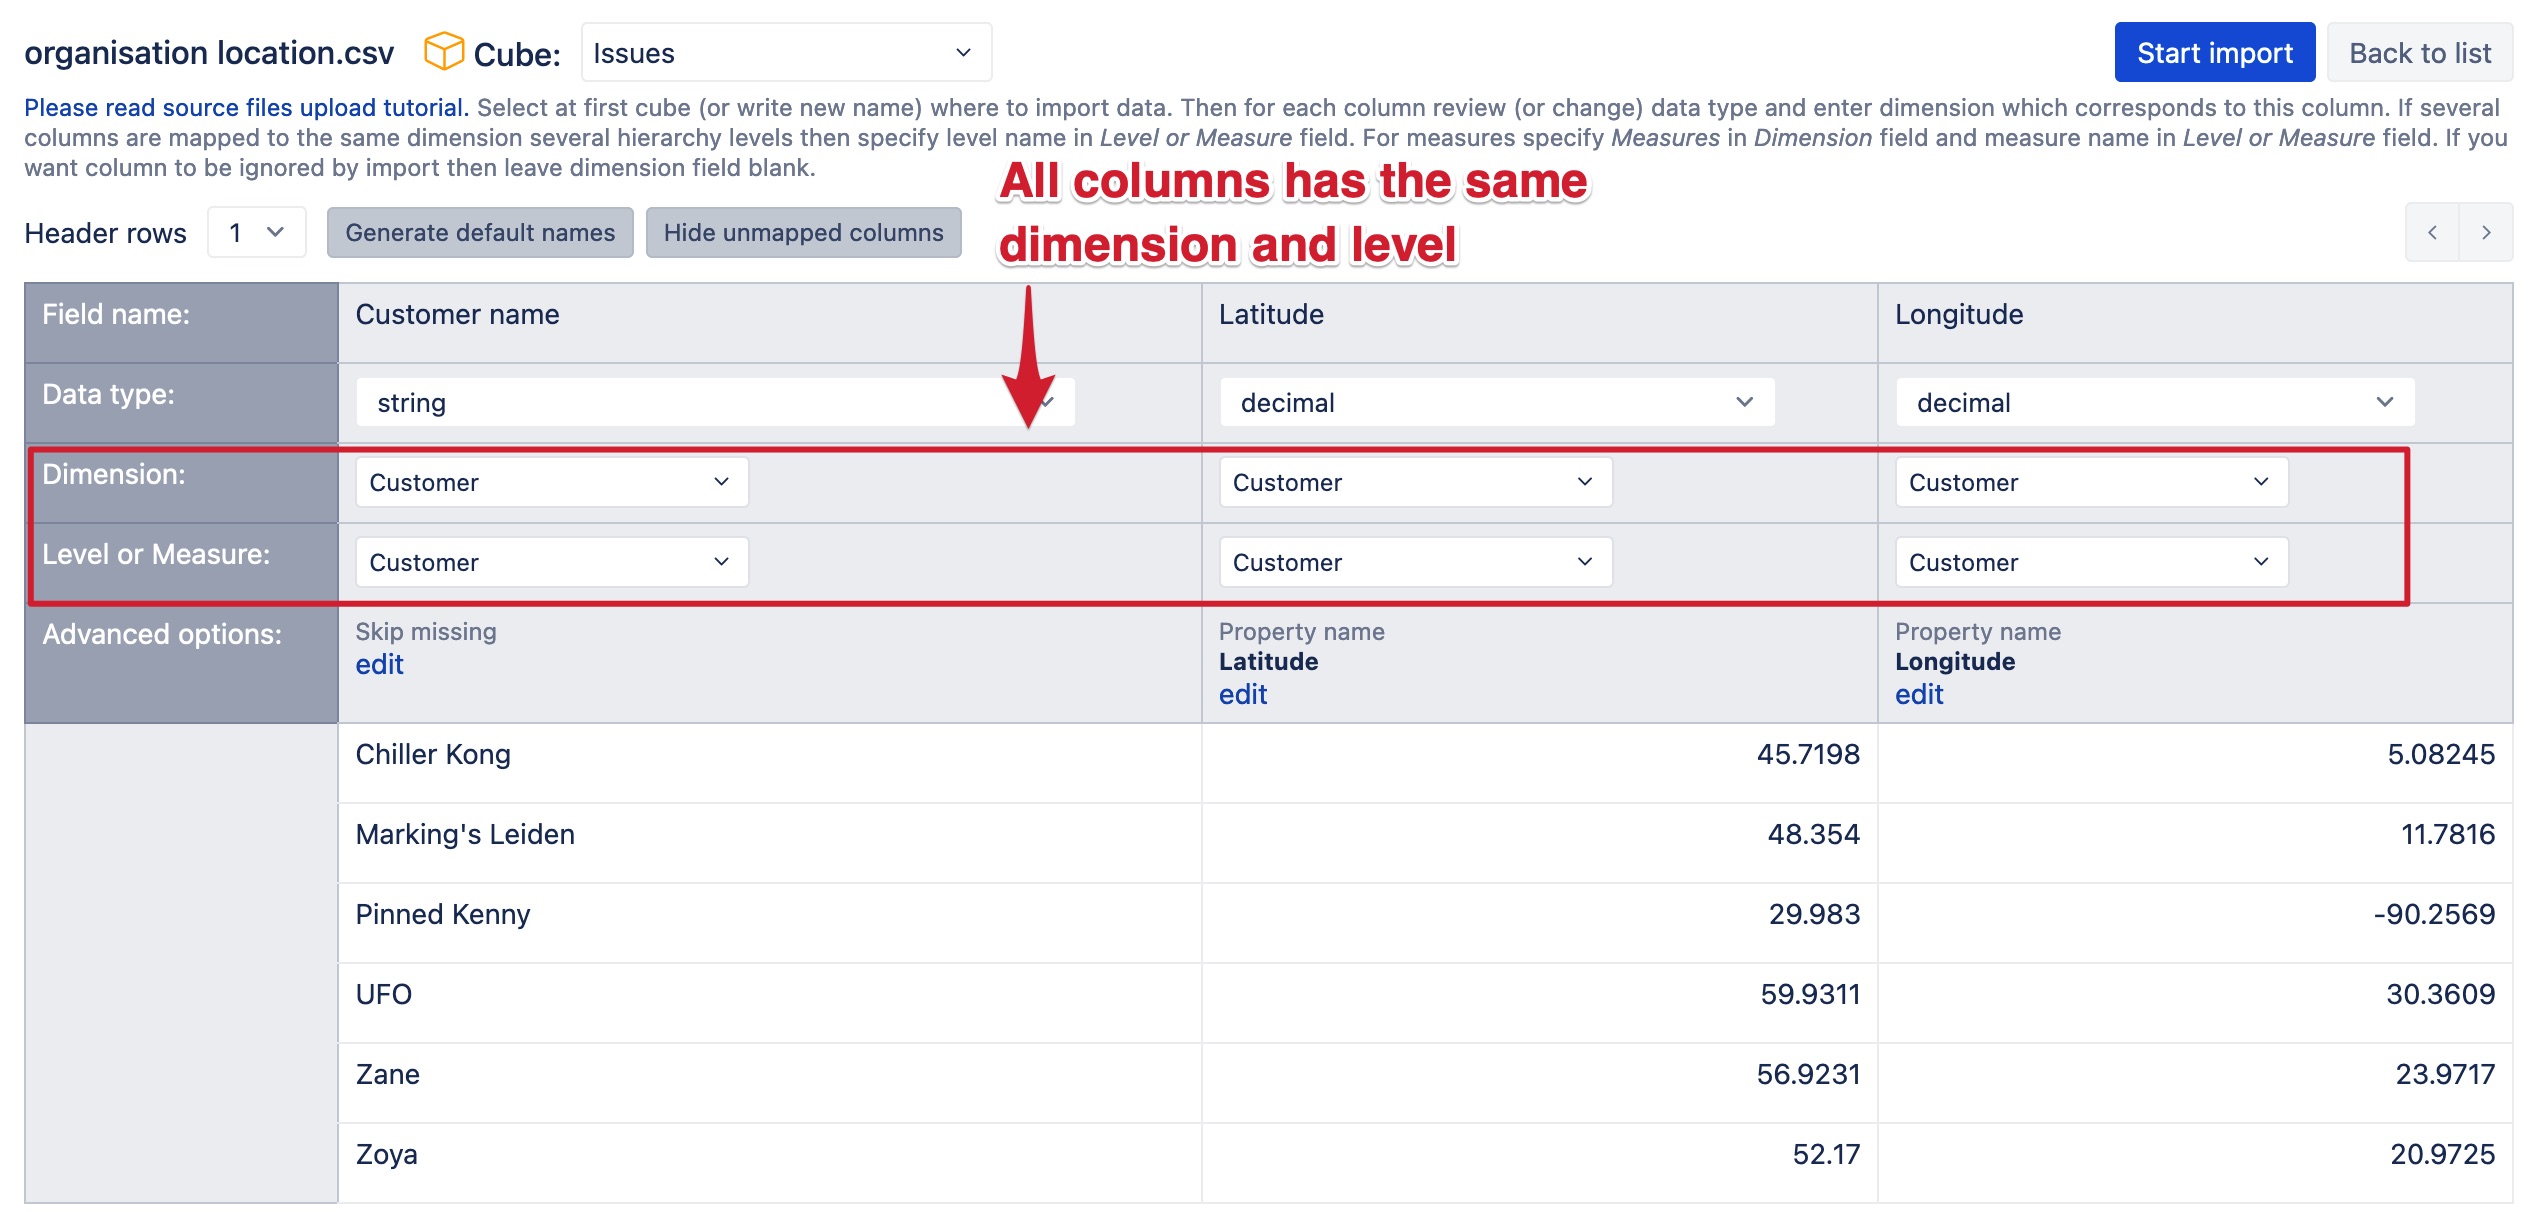
Import geolocation of each Organization with additional data import . The data source should contain three columns:
- Organization name as you see it in eazyBI. Map this column to the dimension Organization, level Organization. In advanced options, mark to “Skip missing”.
- Latitude of geolocation. Map this column to the dimension Organization, level Organization, but in advanced options, enter the property name “Latitude”.
- Longitude of geolocation. Map this column to the dimension Organization, level Organization, but in advanced options, enter the property name “Longitude”.
More details on additional data import here: https://docs.eazybi.com/eazybijira/data-import/jira-issues-import/additional-data-import-into-jira-issues-cube.
-
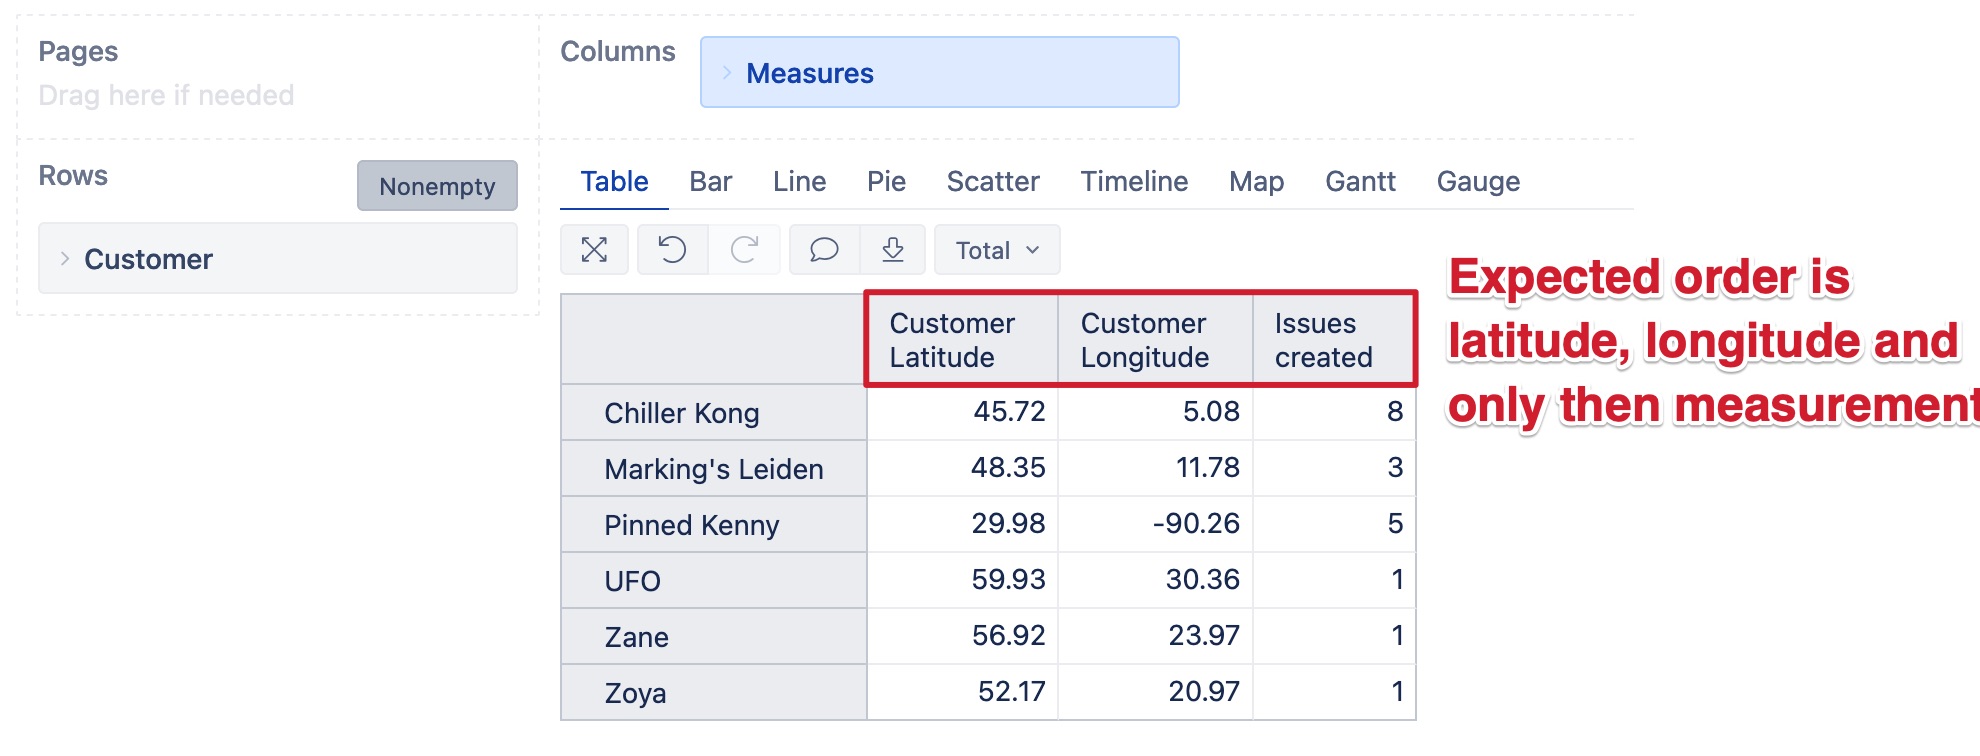
In the report, set dimension “Organization” on report rows. And select custom properties latitude and longitude as the first columns in the report. And the measure representing issues should follow as the 3rd column.
-
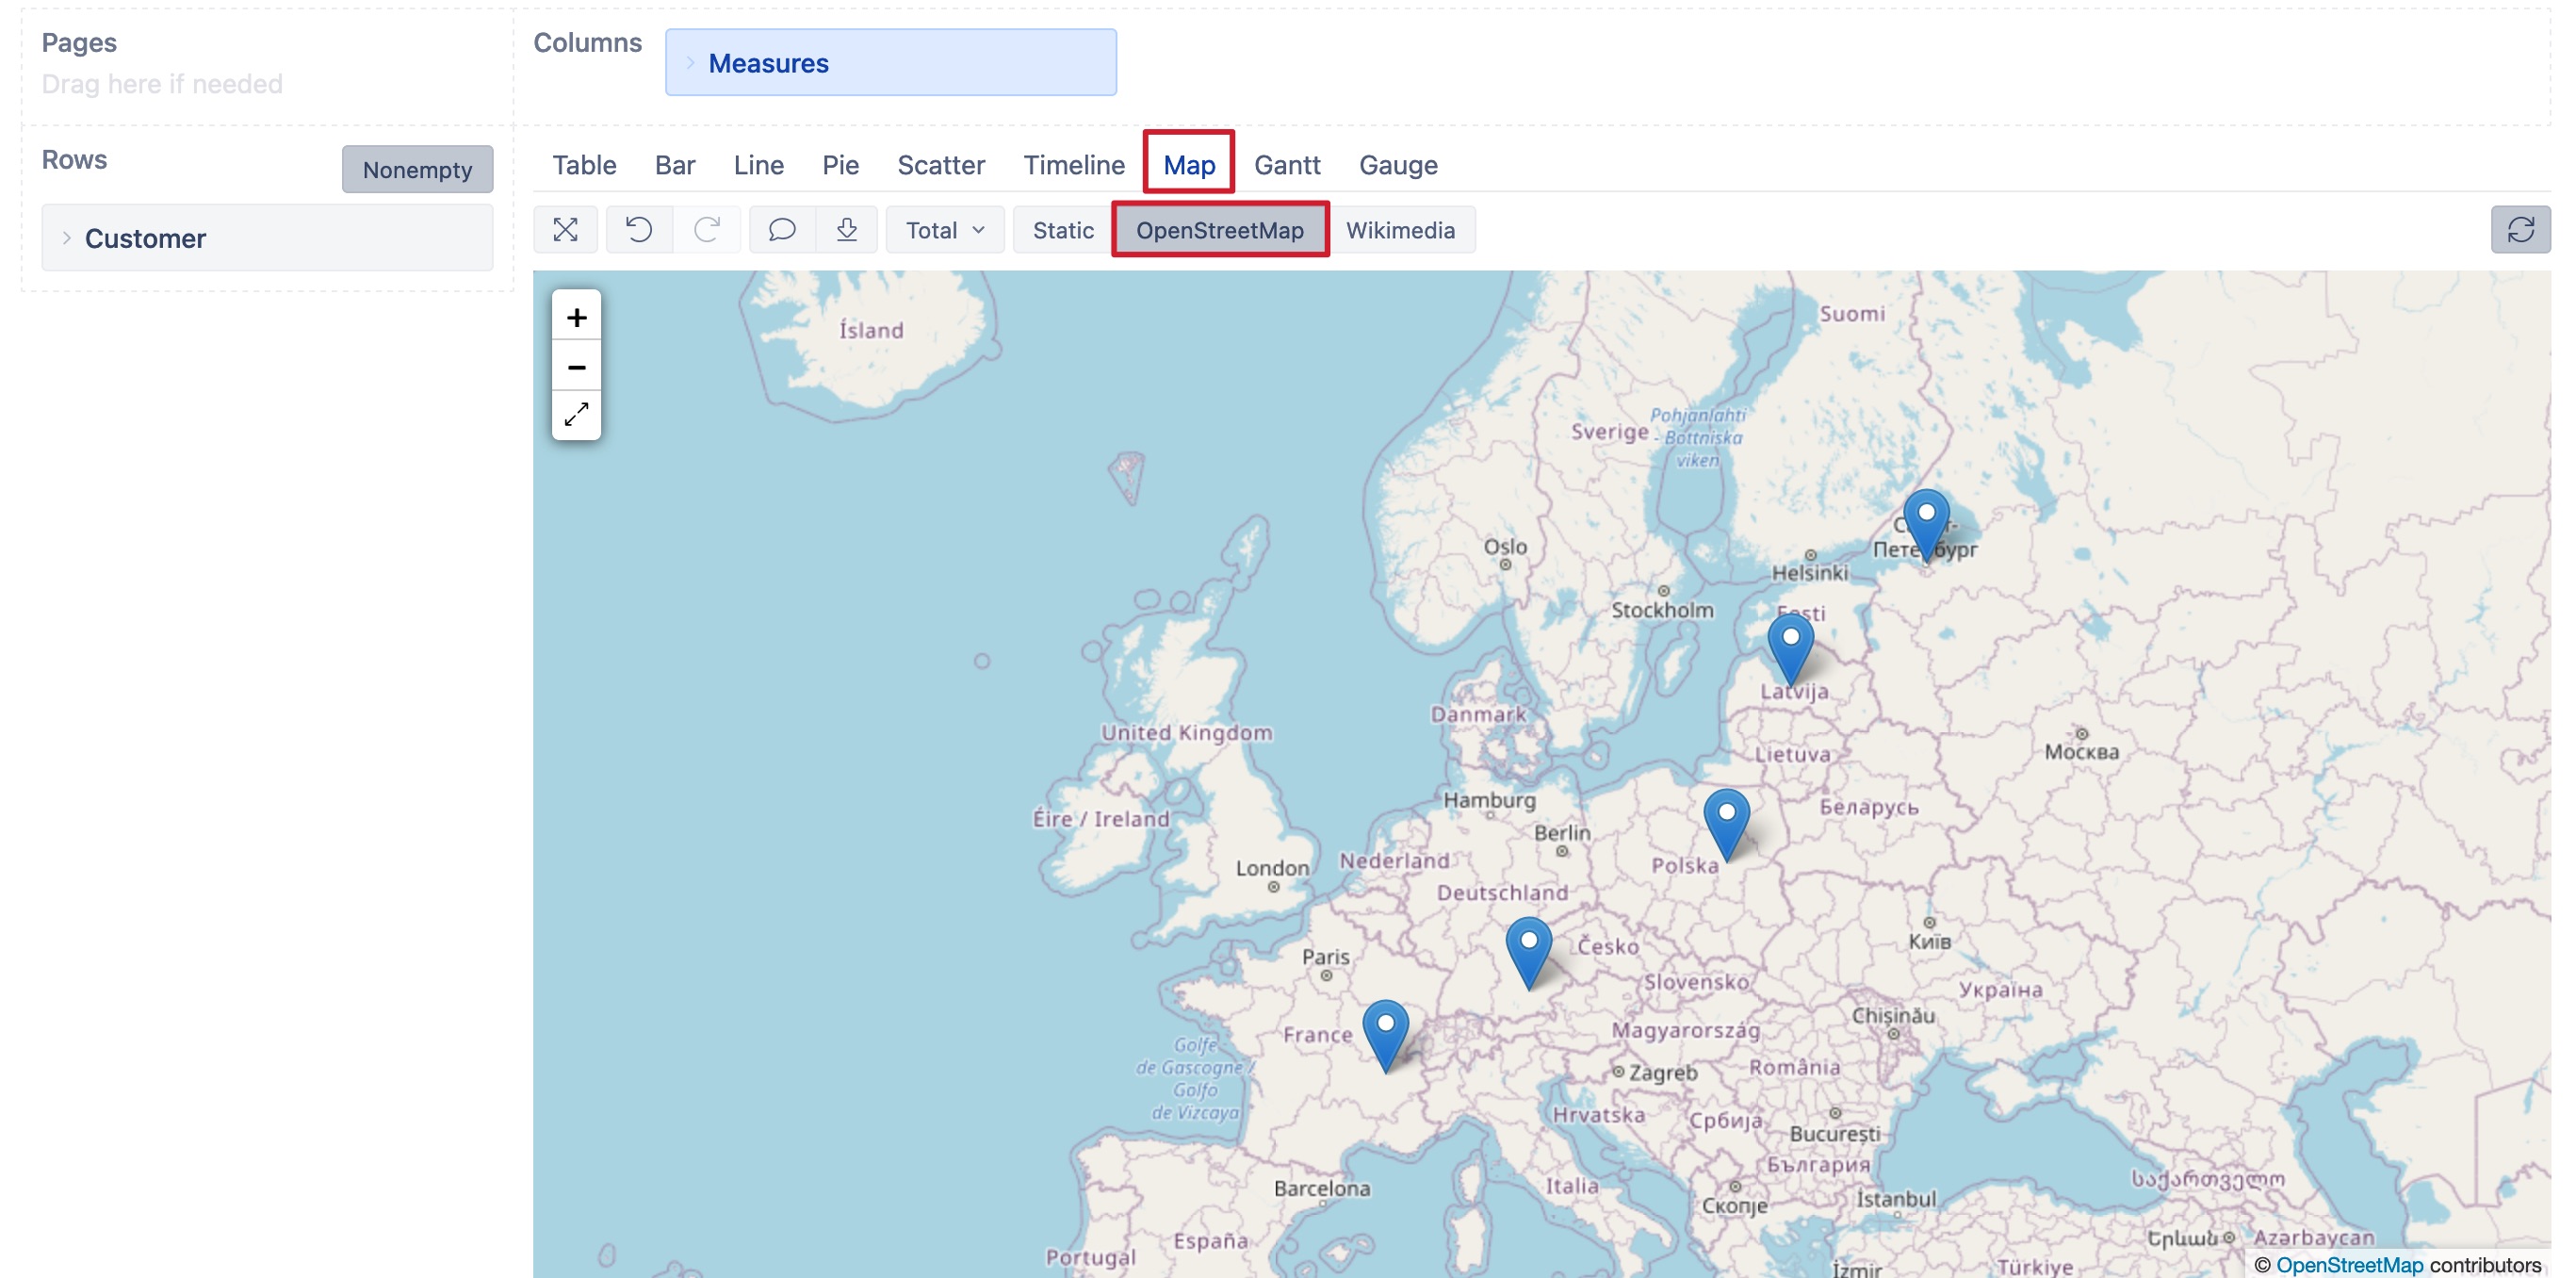
Switch to the Map chart and select OpenStreetMap.
More details on Map charts are here: https://docs.eazybi.com/eazybijira/analyze-and-visualize/create-charts#Createcharts-Dynamicmap.
And here, you can check out an example of a dynamic map chart: https://eazybi.com/accounts/26241/cubes/AirportData/reports/180162-dynamic-map-chart-world-airports.
Best,
Zane / support@eazyBI.com