Measuring Work-In-Progress Limit Throughput

I’ve been trying to figure out a way to aggregate the impact multiple issues in progress have on the overall cycle time.

Ex:

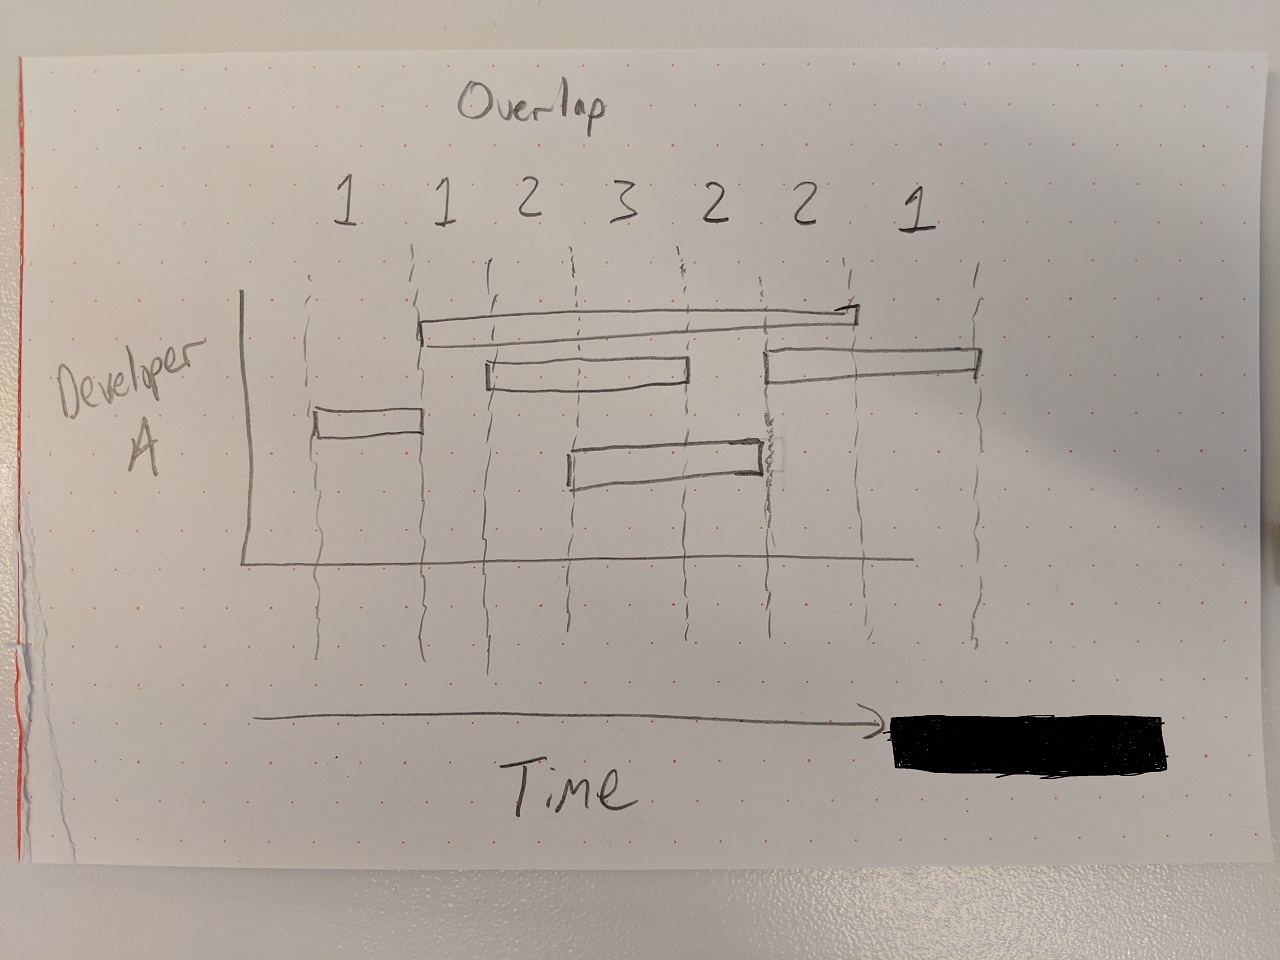
Team EazyBI has 5 developers. When each developer takes on one issue at a time and finishes it before picking up the next item, their average cycle time is 4 days. When a developer takes on two issues at a time and finishes them, their average cycle time increases to 9 days (an increase of 1 day overall than if they had done both items in serial rather than parallel). When they take on three issues at a time and finish them, their average cycle time increases to 19 days (an increase of 7 days overall compared to if they had done all three in serial rather than parallel).

The report would need to calculate when there are two or more items in progress (transition status dimension), per assignee, and only aggregate when those items are actually being worked on simultaneously.

I would also like to separate the aggregated time to show what happens when there’s 1 item in progress per assignee, 2 items in progress at the same time per assignee, 3 items in progress at the same time per assignee, etc.

Basically, I haven’t been able to figure out a way to get concurrency.

From a different report I have a base calculation to gather Min and Max time for a set of issues, as well as their standard deviation. That calculated measure for the Minimum is:

Cache(
Min(
	Filter(
		Descendants([Issue].CurrentMember, [Issue].[Issue]),
		([Measures].[Issues resolved], [Transition Status].CurrentHierarchy.DefaultMember) > 0
		AND [Measures].[Days in transition status] > 0
		-- Including Issue resolution, Issue status, and Issue type in the calculated member speeds up the report significantly compared to putting those dimensions in pages and filtering a larger dataset
		AND ([Measures].[Issue resolution] = "(unresolved)" OR
		[Measures].[Issue resolution] = "Completed")
		AND [Measures].[Issue status] = "Done"
		AND ([Measures].[Issue type] = "Story" OR
		[Measures].[Issue type] = "Spike" OR
		[Measures].[Issue type] = "Bug" OR
		[Measures].[Issue type] = "Task")
	), 
	[Measures].[Days in transition status]
)
)

I’m thinking that I would put assignee dimension into Rows after the Story Point dimension. That way in the calculated measure I could have something like:

AND [Measures].[Concurrency] = 2

in that function so that it would only return the Minimum amount of time it took when 2 items were in progress for that assignee.

I could then change the Concurrency value to 3, or 4, or however many to see the difference in time it takes.

I hope this makes sense.

Again, I’m basically trying to measure the impact that taking on multiple items at a time has on actual cycle time. In other words, why it’s so important to have WIP Limits.

This new report would be a sibling of a prior report created at (Potentially) Complicated Chart

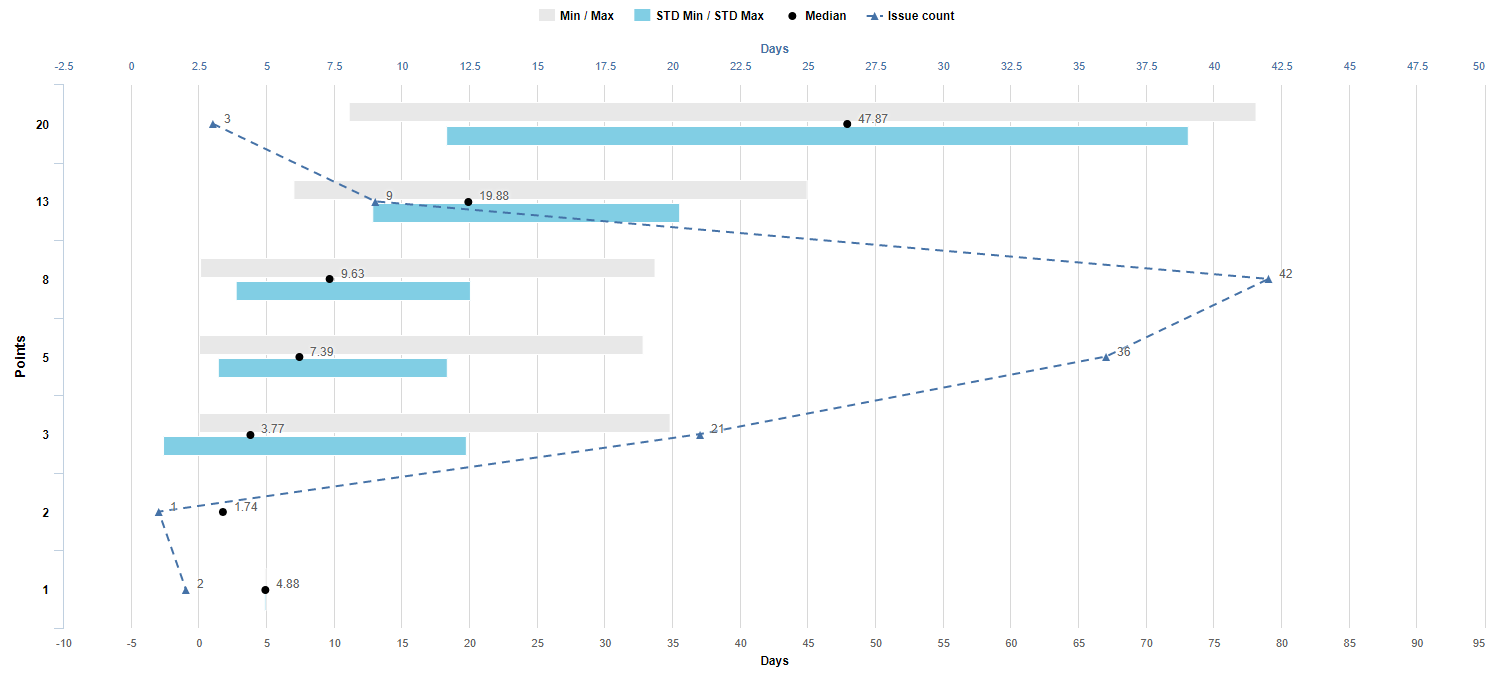
[Story Points] is a new dimension in rows. [Measures] is in columns. [Project], [Time], and [Transition Status] are in Pages.

Thanks for any help that can be provided.

– Malik Graves-Pryor

Just bumping, hoping there is a possibility of measuring issue concurrency per assignee in a report like this.

Fingers crossed.

– Malik Graves-Pryor

Malik,

Sorry for a bit late answer, it took a while to reconsider your use case.

There seems to be a challenge to define what the “concurrency” might mean. We know it intuitively, but it seems too difficult to formalize it for the implementation as a custom calculation in eazyBI.

I guess the concurrency might mean “Number of issues with overlapping durations in some In Progress status.” Unfortunately, eazyBI data model currently is not suitable for such a calculation. eazyBI can track durations of issues in statuses, but it is hard to know “other issues” having the overlapping duration.

Note also that the definition provided above has its shortages. For instance, if the developer takes two concurrent tickets in the morning, completes them, then takes three more in the afternoon. If the developer works for one ticket for the whole week, takes two more simultaneously on Monday, three more on Wednesday and four more on Friday? What might be the “concurrency” for these cases?

Playing with such cases leads us to think that the definition needs an “attraction” in time. Here another limitation comes in. The Time dimension cannot have better granularity than the daily level.

Perhaps a reasonable simplification might be just counting the number of issues assigned for the developer during the period, assuming that those are of similar size “on average.”

Anyway, thanks for bringing up this case; your topic seems worth a white paper in some software engineering conference. It is a regret that we cannot show the way to proceed with such research with the help of eazyBI.

Kindly,

Hi Janis,

No worries at all, I’ve been contemplating this for several weeks without much luck so I definitely understand the challenges you’re talking about :slight_smile:

How about approaching this then in a simpler and different manner to achieve the same goal. At this time I’m less concerned with the granularity of the time dimension than I am with the aggregate rollup time whenever there are 2 or more issues in a state of progress.

So in the example that you gave, the two concurrent tickets in the morning would be added to the “two” concurrency rollup. The three in the afternoon would be added to the “three” concurrency rollup.

The one ticket open for the week would be in the “single” concurrency rollup when it’s being worked on alone, and added to the “two” concurrency rollup when one other item is in progress, and show up in “three” when two other items are in progress.

The aggregate rollup at the end of the time period (time dimension slice. I typically choose quarters or months) would then show that the solo item was actually “single” for 2.3 days. It was part of the “two” concurrency rollup for 1.7 days and part of the “three” concurrency rollup for 1.3 days.

I was thinking that it could simplify the dataset.

I drew this as a representation of that dataset example. Let me know what you think?

Because I would be aggregating all of the issues by estimate size (story points), having a single issue as a representative might be useful.

For example, if the median time to completion for “clean” 8 pt stories (completed alone) is 1 day, then over the 7 day time period in the chart above, the expectation would be that 7 8pt stories would be completed if done in serial.

However, in this example only 5 stories were completed. Thus you could argue that the marginal cost of concurrency was 2 issues…?

Would something like that be feasible? Trying to attack the problem from a different angle…

– Malik Graves-Pryor