Hi
I have the following SLA for First Response :
P1 incident - goal 1hr
P2 incident - goal 2hrs
P3 incident - goal 4hrs
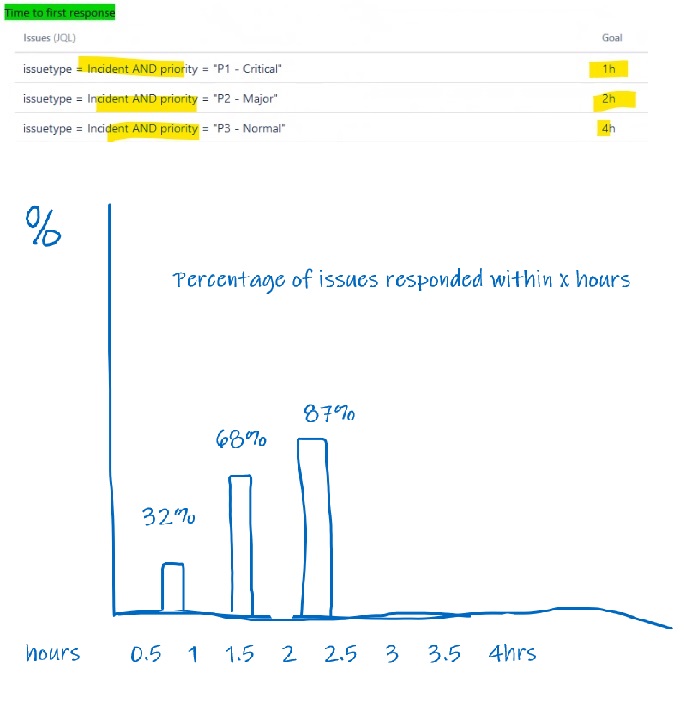
i would like to present this as :
percentage of issues were first responded in less than 1hr, 1.5, 2, 2.5hr etc
i want the timeline to be in hours and not days, month etc.
any idea how i can present the timeline in hours?
i tried the difference in hours between issue created and time to first response…
DateDiffHours(
[Measures].[Issue created date],
[Measures].[Issue Time to first response Due date]
)
Please use Time to first response custom field ID instead of NNNNN in all places in the formula.
I used the hours as an interval unit. You can set the full hours there only, though. If needed, set the interval minutes and set values in minutes to get the 0,5h (30m) and 1,5h (90m).
Add the custom field definition to eazyBI advanced settings or ask Jira administrator or eazyBI administrator to do this for you. eazyBI advanced settings are common for all accounts, and only Jira/eazyBI administrators have access to the settings.
Then you will be able to use this dimension in the report. You might want to check how to set the needed intervals.
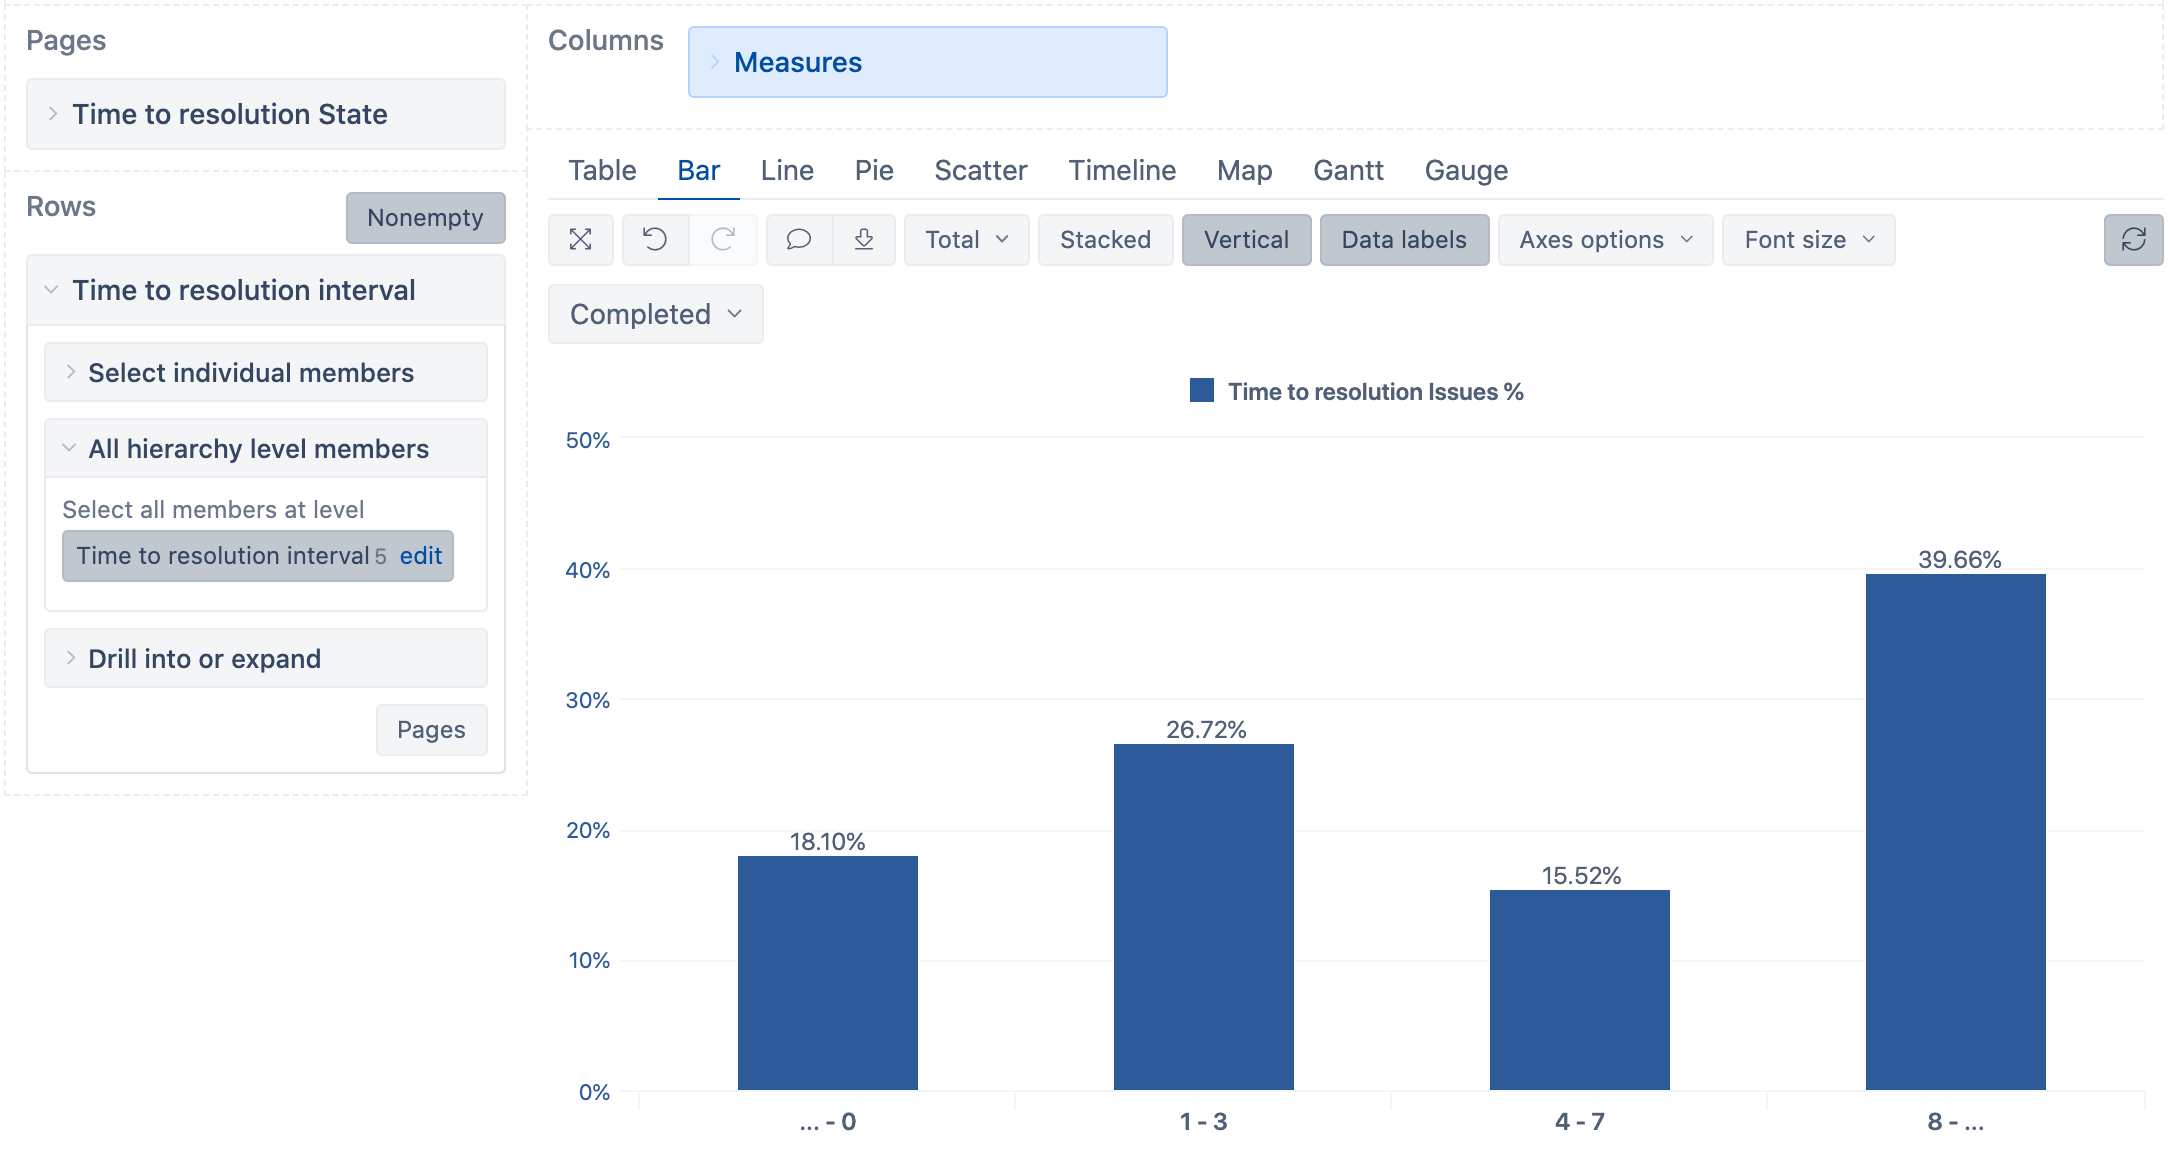
Add the dimension to Rows and expand to member level. Add measure Time to first response issues to the report. Click on the header of the measure in the table chart and use Add calculated > Total or Rows to get the % for each interval. Then select the measure Time to first response & for the report only and switch to Bar chart. I would suggest using a filter by Time to first response state - Completed as well. The interval dimension will work for completed cycles only.
Here I made a similar report using another SLA Time to resolution with a similar dimension Time to resolution interval:
Very interesting report!
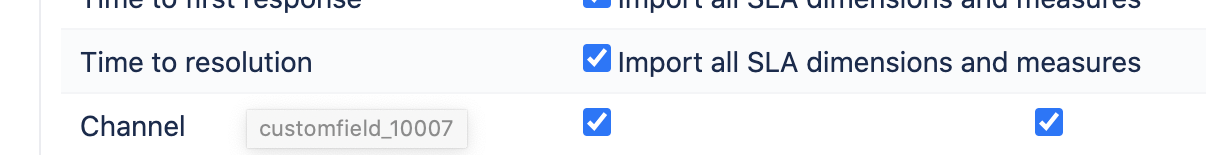
Please excuse this basic question, but how do I find the name of my “Time to first response custom field ID” in order to replace the NNNNN in your formula?
You can also open the import options in eazyBI and mouse over a particular custom field, in this case, your SLA. eazyBI should show you the custom field ID in a small pop-up.