Hi,
I request your support as I am not able to perform the queries on my own. I have defined a custom field which is based on issue links:
This link type is used to track the coverage between two issue types (Requirements & Tests). A requirement is considered as covered if there is at least one Test linked to it.
I am able to calculate the global coverage with the last refreshed data set but I would like to plot the coverage evolution during time. To achieve this goal I have defined the following settings:
- Pages: Project, Issue Type, Status
- Rows: Time, Weekly
- Measures: [Measures].[Issues history]
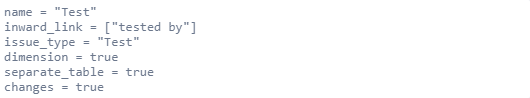
Now, I would like to add a new measure based on a weekly timeline to known how many issues are covered using the above custom field. I tried to add the two following parameters to the custom field but I am getting errors so it looks that it’s not working:
- separate_table = true
- changes = true
I searched the forum and found this link that might help: Issue linking - History - Questions & Answers - eazyBI Community
But I am blocked to go further. Any help would be appreciated.
Regards
Hi,
I didn’t understand… can’t you see the content to which the link points?
I have no idea why you are blocked
Copy it for you?
Hi,
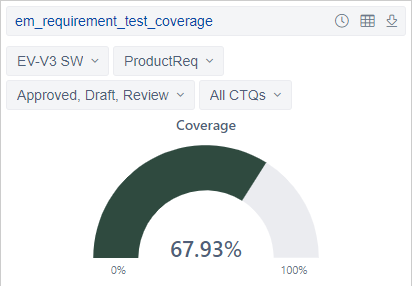
Here is the result for a live data calculation:
This calculation is done using the following rules:
- Requirement Jira issue type is used to detail product specification
- Test Jira issue type is used to detail a product test
- Coverage (%) is the division between all the Requirements in the product and all the Requirements ns the product covered by at least one Test (“tested by” relationship).
Now, I would like to see the coverage evolution on a weekly basis to highly the coverage trends. This is achieved with historical measures but I don’t known how to calculate the coverage value for each weekly steps. Meaning that for every week, I need to know the number of Requirements in the product and the number of Requirements covered by a test (“tested by” relationship) to perform the calculation.
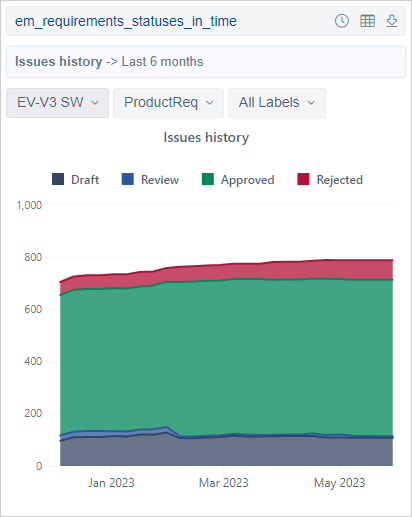
To illustrate, below is a time representation of the Requirement statuses on a weekly basis. I would like to do the same for the coverage value to plot the trends.
Regards,
Vincent
@vcottineau ,
eazyBI does not receive information on when the line between Test and Requirement is created. You may get a list of currently available links (the report you already have).
Those two parameters, separate_table = true and changes = true, are not supported for issue link dimensions. Those could be used only on single-select issue custom fields (Advanced settings for custom fields).
Best,
Zane / support@eazyBI.com