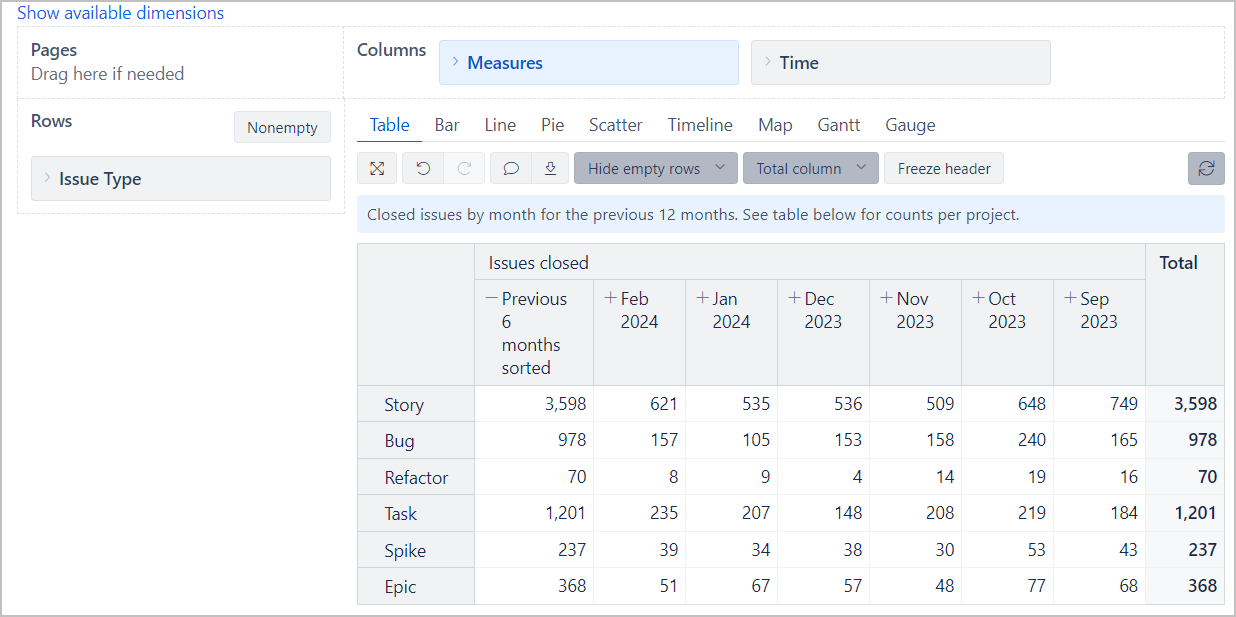
In this question, replacing the total row at the bottom of the table with the average of the values in the column works great. Is there a way to do the same thing with the total column on the right? I have a table with rows of issue types, columns of Time (months), and a metric of issues closed. Rather than seeing the total on the right, I would like to see the average of all the previous columns, regardless of how many there are. Here’s what the table looks like:
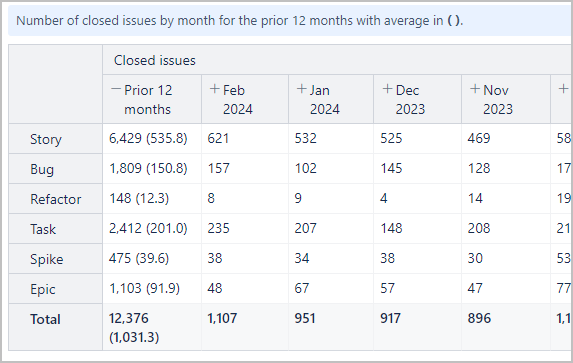
I found a solution that works for me. I changed the calculation of the first column to show both the total and the 12-month average, and I removed the report Total column. Here is the new custom measure using Markdown formatting:
CASE WHEN [Time].CurrentMember.Level.Name="(All)"
THEN
  Cast(Format([Measures].[Issues closed], "#,###") as string) || " (" ||
  Cast(Format([Measures].[Issues closed]/12,"#,###.0") AS string) || ")"
ELSE
  Cast(Format([Measures].[Issues closed], "#,###") as string)
END
So now the table looks like this:
It would be nice if the number of months for the average wasn’t hard-coded as 12, but I haven’t figured out how to determine the number of months in the table.
It doesn’t have to be a fixed integer 12 always in the formula.
Try using another calculated measure (instead of 12) where you count the children in the aggregate “Previous 12 months” or any other calcualted member.
CASE WHEN [Time].CurrentHierarchyMember.Level.Name="(All)"
THEN
Count(
Childrenset([Time].CurrentHierarchyMember)
)
END
That should return result 12 for your calculated member “Prior 12 months”