Hi there,
We utilize a custom field called investment type to classify what kind of work each issue relates to. I am trying to generate a report that will show me sprint over sprint how much work was done towards each investment type. Where I am running into issues is limiting this to just the last two sprints or really anything time related. In addition, I can’t tell if the percentage it is giving me is based on number of issues or story point related. Getting this down to story points would be even better!
Below is a screenshot of how far I have gotten so far (for time I have last 4 weeks selected):
Hi @Paula_Pokusa ,
While I don’t know what stands behind the numbers in your calculated measures, I suggest basing them on Sprint scope measures - Jira Software custom fields.
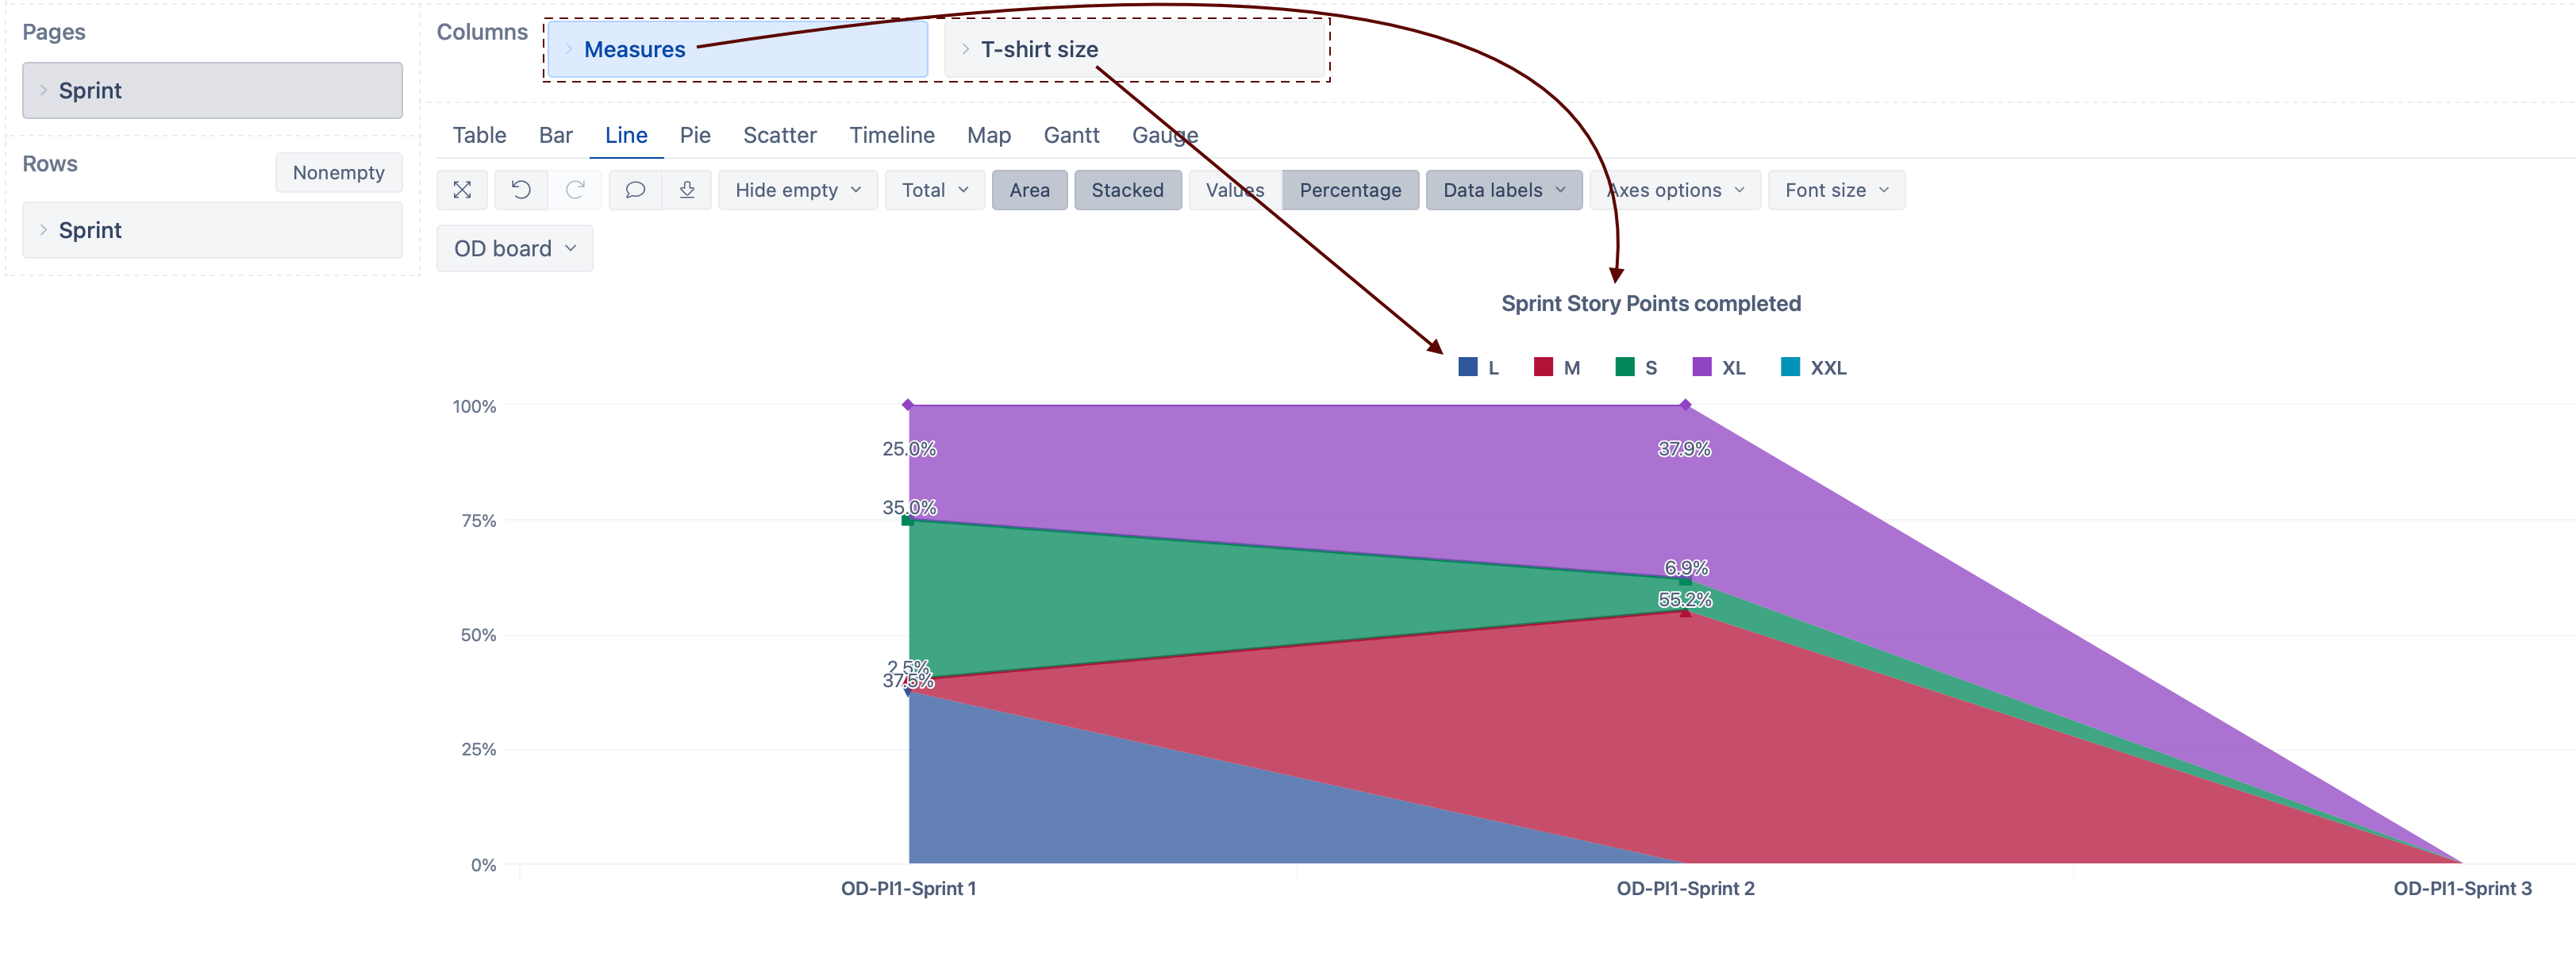
Suppose you look for the number of Story Points completed within each Sprint from issues with specific values in the mentioned custom field. I recommend using the Sprint scope measure “Sprint Story points completed” as the base. See an example with the custom field “T-Shirt size” below:
You can find an example of filtering a couple of last Sprints from a specific board on our documentation page - Sprint velocity chart. You can use and adjust the measure “Last closed sprints by boards” from the linked report example.
Best,
Roberts // support@eazybi.com
Hi Roberts,
Thank you for that information, I think I am able to get that portion now without any issues.
I was also wondering if you had a suggestion for the issue I am having with the time constraint. In my screenshot you can see multiple blank sprints even though I added the time constraint of within the last 4 weeks. Any fix to removing sprints older than the time constraint set?
Hi @Paula_Pokusa ,
With the Time dimension filter in pages, you limit the measures - their values are empty for older Sprints. That is because the measures are tied to the Time dimension and not the Sprints. But the measures are also tied to the Sprint dimension.
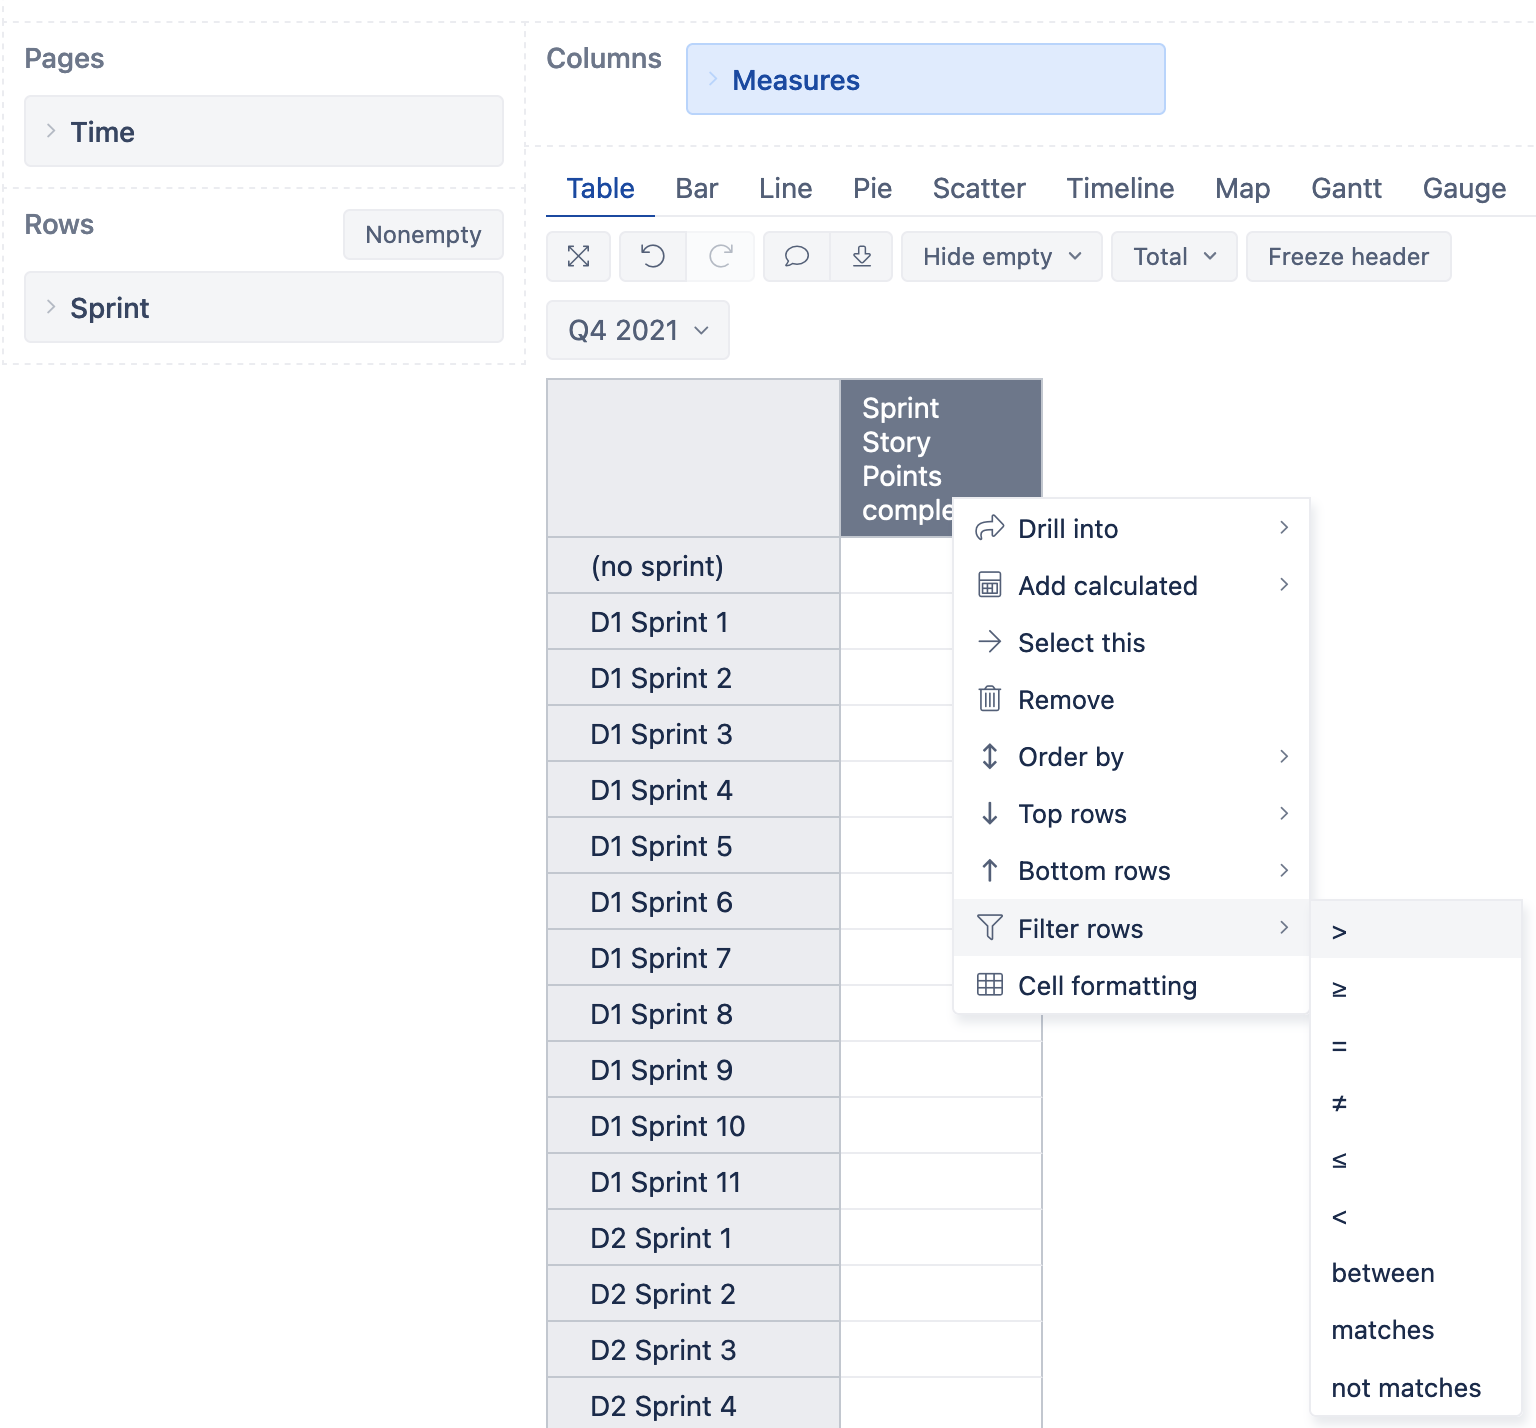
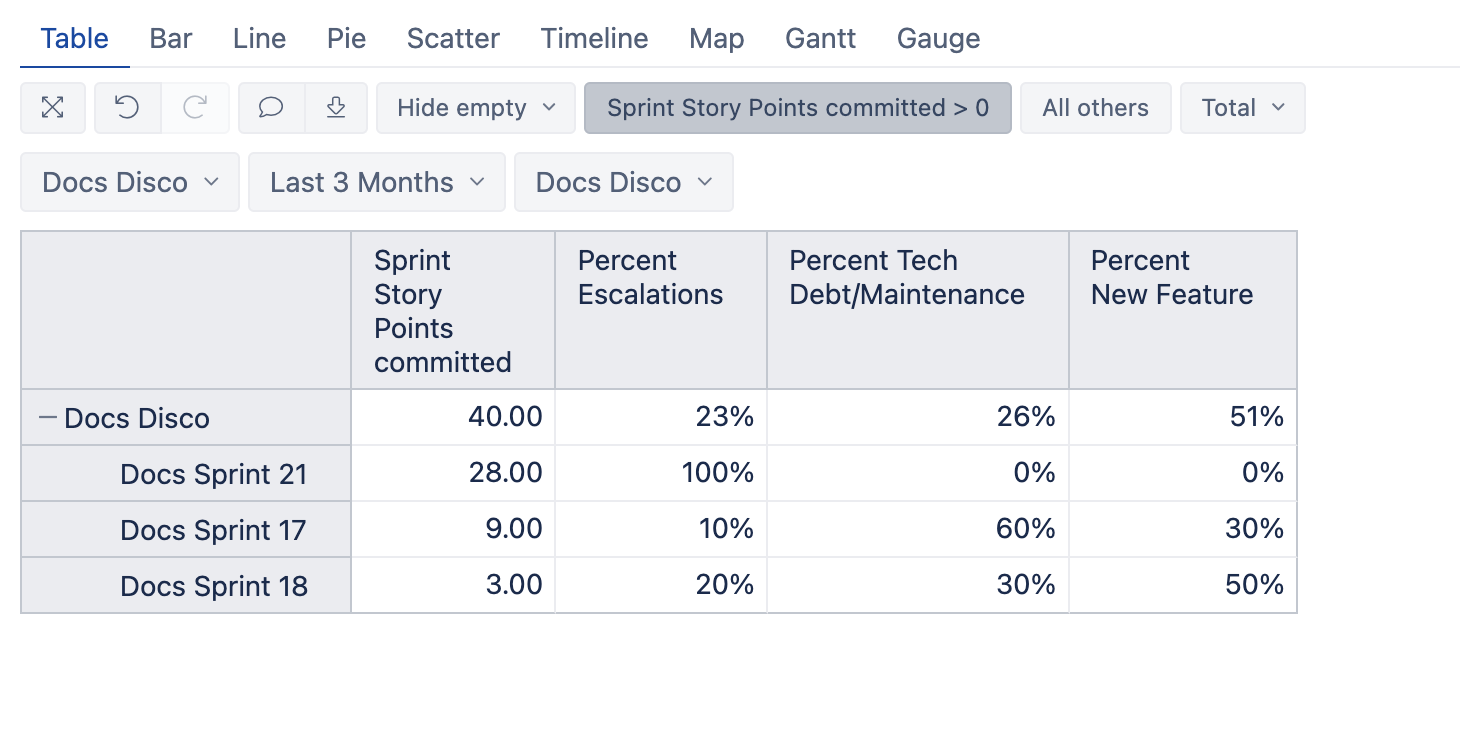
I recommend switching the report to the table view and temporarily removing the custom field dimension from the columns in this particular case. Now, filter the report rows by the measure to be greater than zero. See the screenshot below:
Now you should see only the relevant Sprint dimension members. Next, add the custom field dimension back to the report and switch to the desired chart.
See more details on filtering report rows by a measure on the eazyBI documentation page - Create reports.
Best,
Roberts // support@eazybi.com
Hi Roberts,
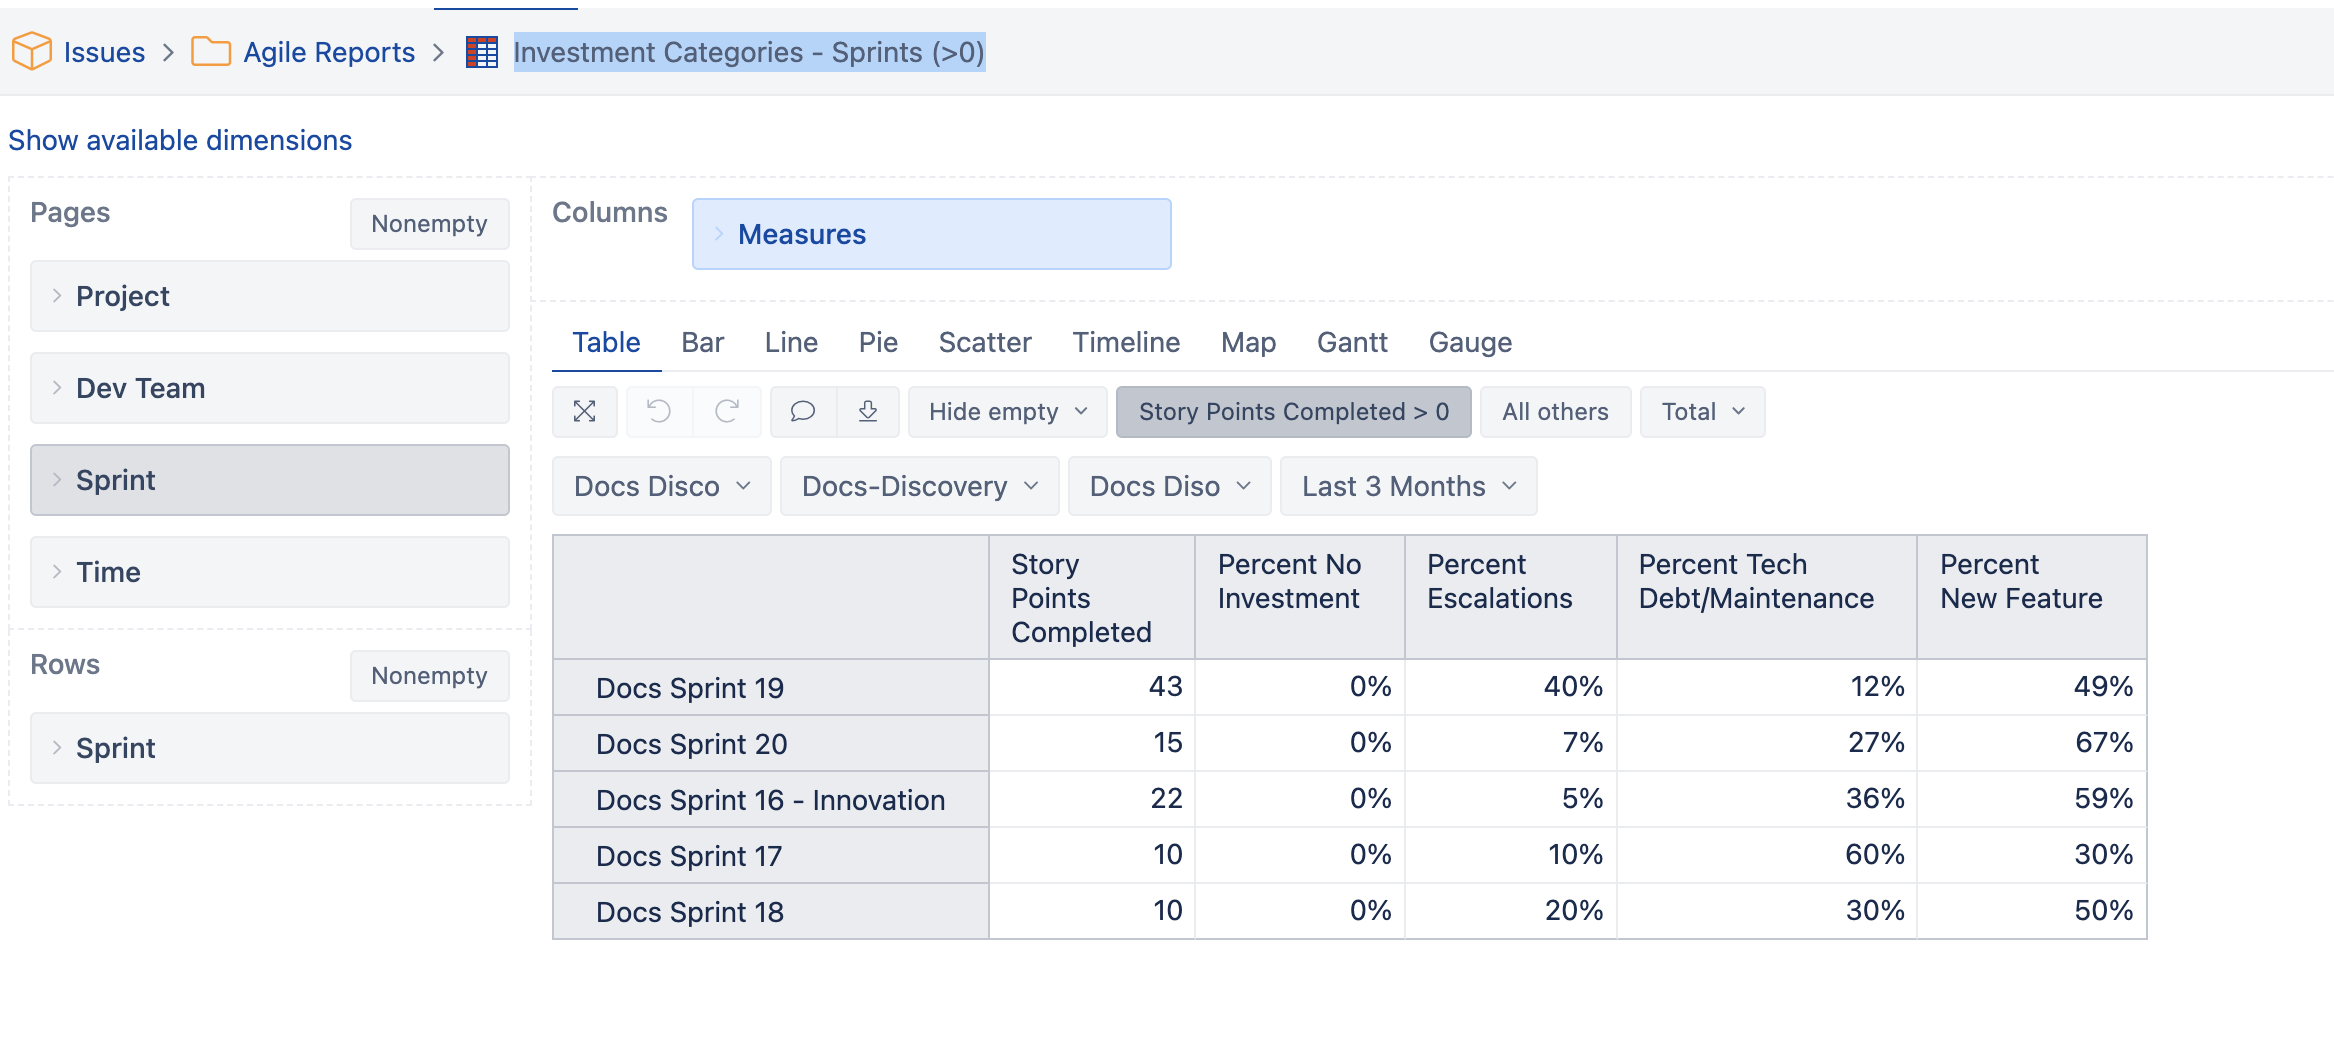
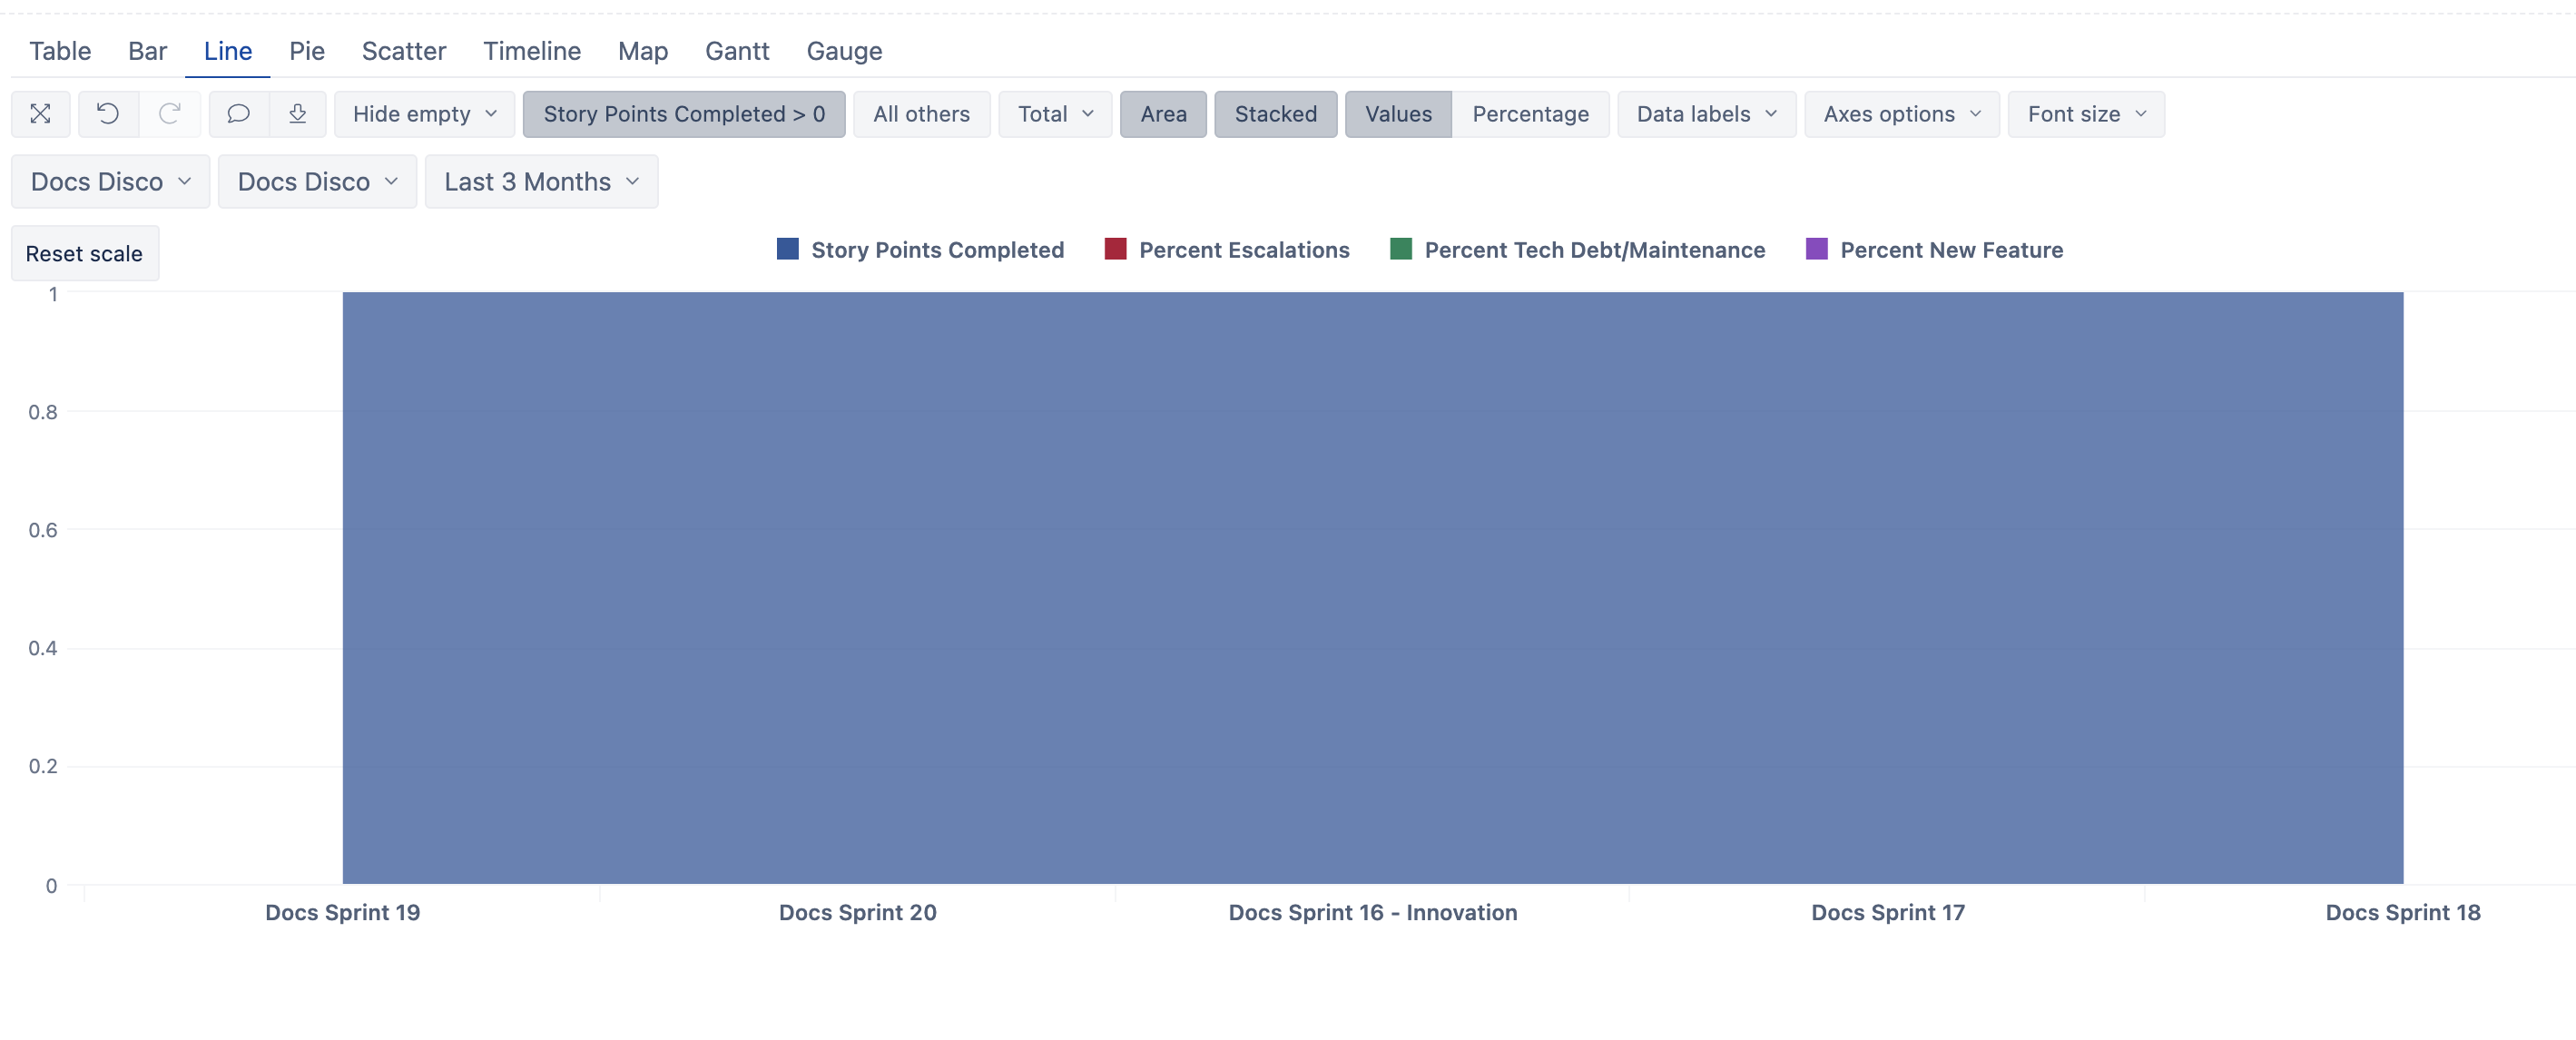
That doesn’t seem to work as intended as once I filter the report it shows the data in the graph (minus the latest sprint, #21, and I am not sure at all why) but then the other charts do not seem to work. Below is the screenshot of the table and then a different chart. Any help would be great, not sure why this report has been such a tough one.
Hi @Paula_Pokusa ,
Is Sprint #21 completed? If not, that would explain why it is not showing up as there are no completed Story Points yet in this Sprint. Suppose you want to consider Sprints not yet completed. Then, you can use “Sprint Story points committed” instead of “Sprint Story points completed”.
Once you have set the filter on the measure “Sprint Story points completed”, you can remove it from the report.
Best,
Hi Roberts,
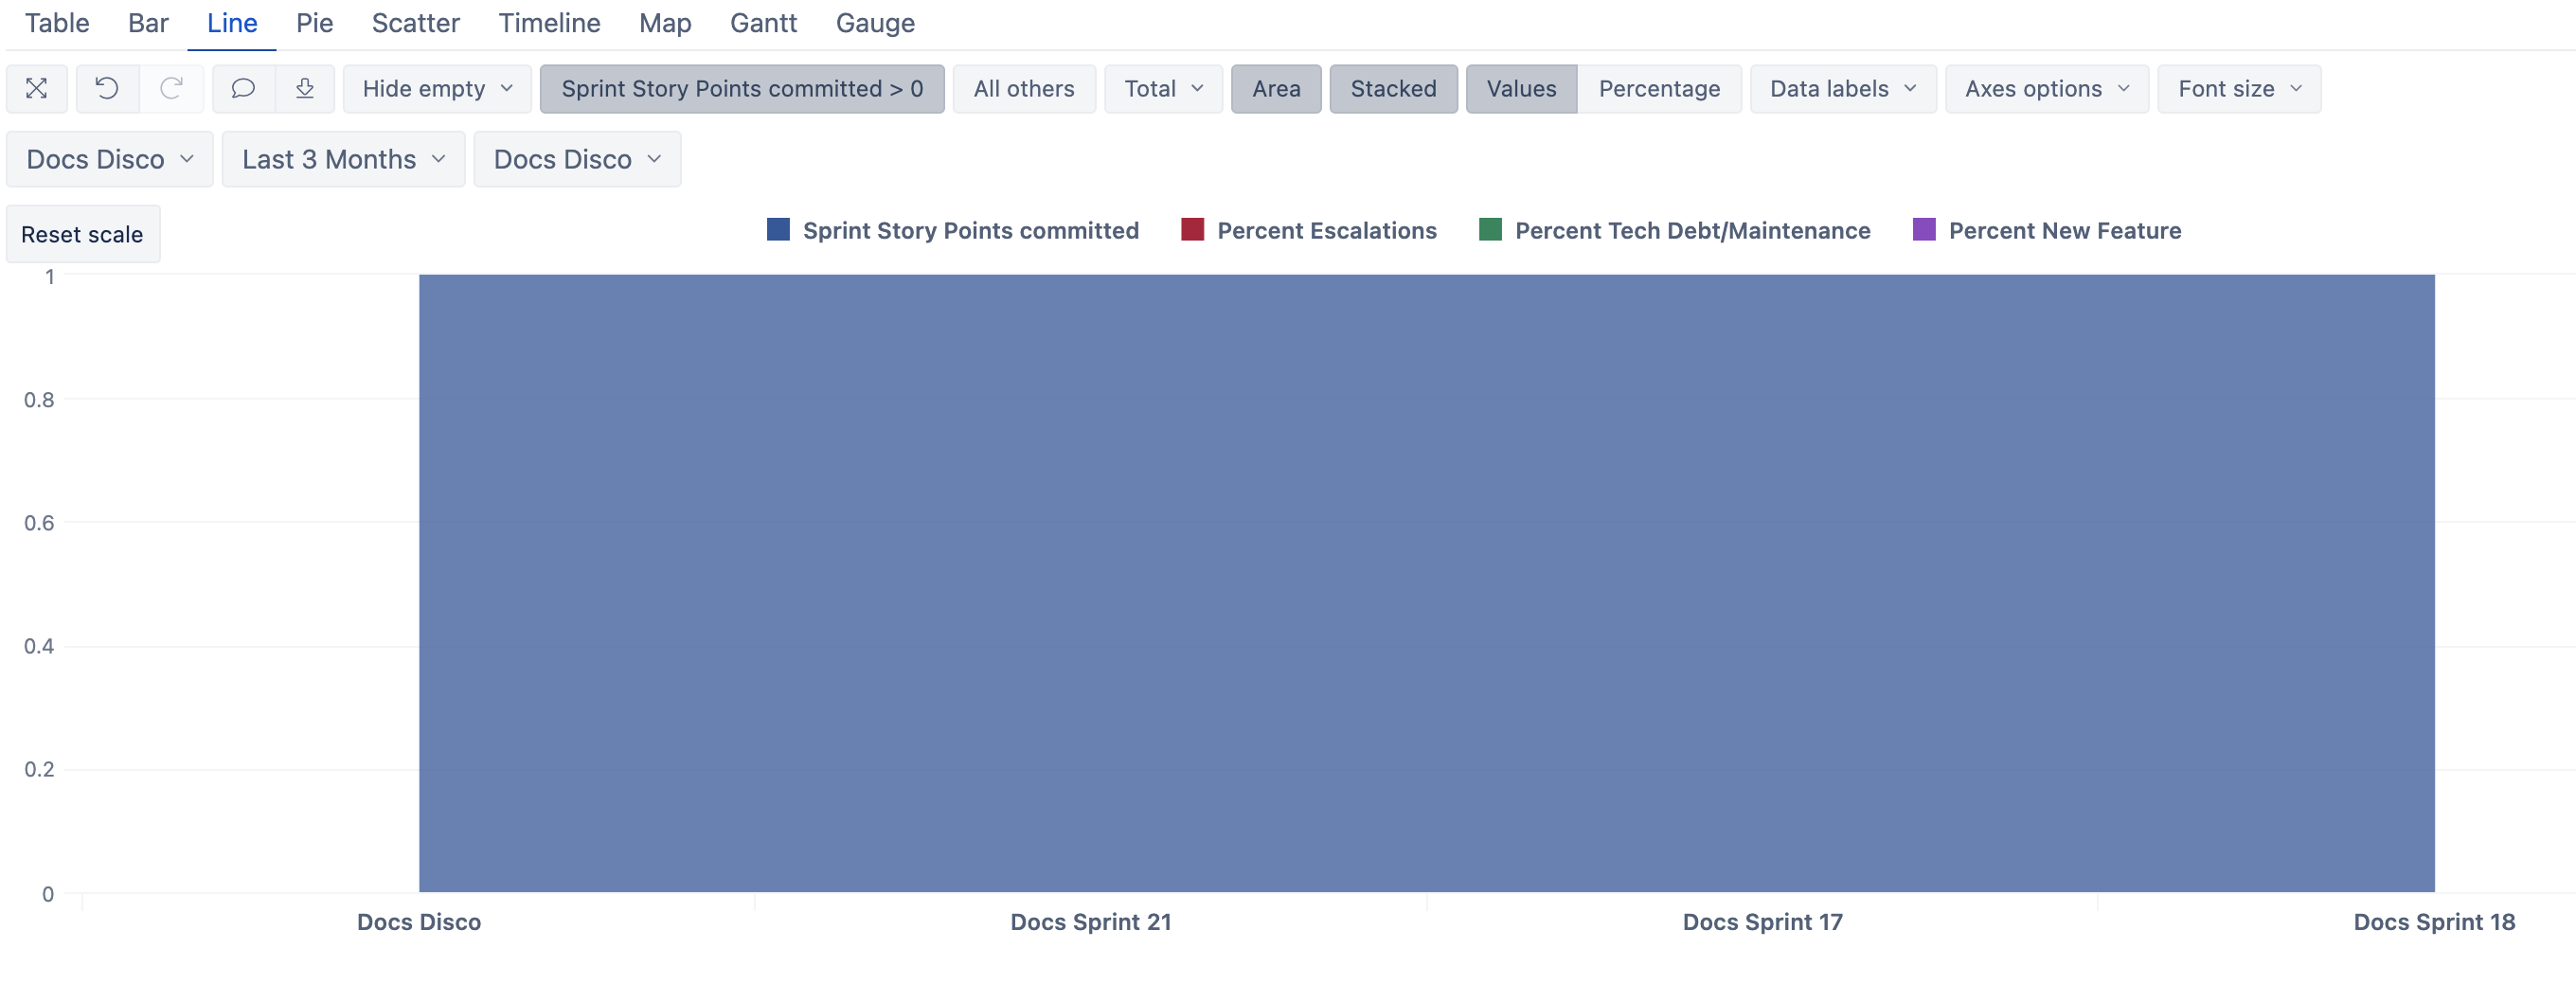
Is this just not possible with EazyBI? I did add committed points and removed completed. A couple of issues with that is it is now showing incorrect data for the current sprint and the other graphs are still not working. I know that the data shown in the screenshot below for sprint 21 is absolutely wrong and there should be a total of 9 issues across all investment types. I am beginning to think you cannot mix closed and an open sprint in the same report.
Hi @Paula_Pokusa ,
First, the measure “Sprint Story Points committed” measure overshadows the rest of the measures in the chart. You have filtered the report by it. Therefore you can remove it.
Which values of the percent metrics are wrong for the Sprints? I recommend sharing the report definition to support@eazybi.com, referencing this community thread. Please see the eazyBI documentation on exporting a report definition - Create reports.
Best,
Roberts // support@eazybi.com