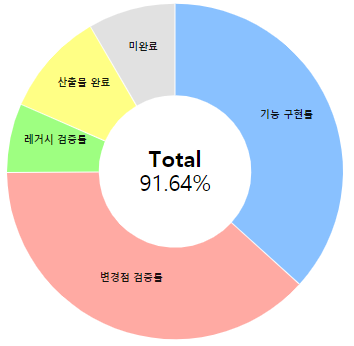
Hi. I developed my own chart like this.

And I want set color to this graph.
So I make “color picker panel” by javascript, and set color to graph.
But in Dashboard, color data not saved.
How can I save color data for each Analyze?
Hi. I developed my own chart like this.

And I want set color to this graph.
So I make “color picker panel” by javascript, and set color to graph.
But in Dashboard, color data not saved.
How can I save color data for each Analyze?
Hi @1115 ,
Please see the eazyBI community post here - Option to define custom color schemes.
Best,
Roberts // support@eazybi.com
I make script and include color.js like that post.
Eazy.Colors.mainColors = [’#4572A7’, ‘#AA4643’, ‘#89A54E’, ‘#80699B’, ‘#3D96AE’, ‘#DB843D’, ‘#92A8CD’, ‘#A47D7C’, ‘#B5CA92’,’#DA8D98’, ‘#81CEE4’, ‘#DBC63D’];
Highcharts.setOptions({colors: Eazy.Colors.chartColors(36)});
But this error is accurred
Uncaught TypeError: Eazy.Colors.chartColors is not a function
at colors.js:2
Hi @1115 ,
The error is unexpected. Please share the paths you saved the colors.js and _custom_head.html.haml files in and share the file contents.
Make sure to follow the instructions as they are suggested and replace the colors.js content with the one below:
Eazy.Colors.chartDefaults = function(){ return ['#005EB8', '#93C90E', '#89A54E', '#80699B', '#3D96AE', '#DB843D', '#92A8CD', '#A47D7C', '#B5CA92','#DA8D98', '#81CEE4', '#DBC63D'] };
if(Highcharts){
    Highcharts.setOptions({colors: Eazy.Colors.chartDefaults()});
}
Best,
Roberts // support@eazybi.com